
Trends
Trends shows one figure, such as sales or net profit, for each of your products across a run of months, weeks or days, coloured as a heatmap. Use it to spot products that are growing, fading or seasonal. To open it, in the sidebar, under Workspace, select Trends.
Choose what the heatmap shows
Section titled “Choose what the heatmap shows”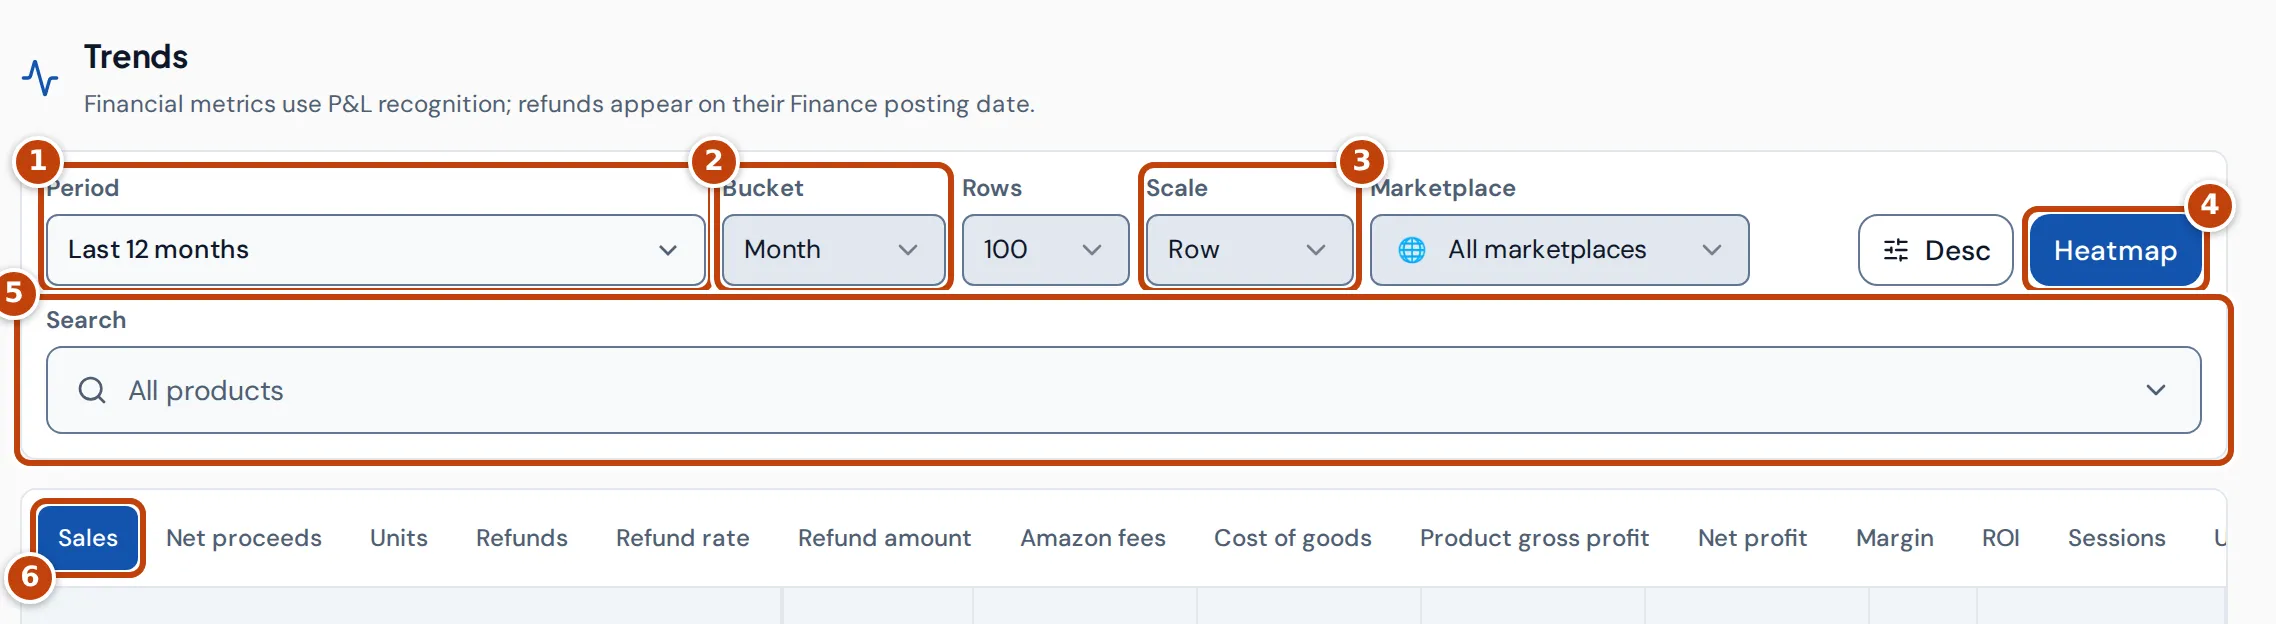
- marker 1 Period chooses the dates: Last 12 months (the default), Year to date, Last 90 days, Last 13 weeks, Last 30 days or Custom range. Each option also sets the bucket: months for 12 months, year to date and custom ranges, weeks for 90 days and 13 weeks, days for 30 days. After a custom range, Reset date range goes back to the last 12 months.
- marker 2 Bucket sets the length of each column: Day, Week or Month. Weeks run Monday to Sunday.
- Rows sets how many products to show: 50, 100, 250 or 500.
- marker 3 Scale sets what each colour is relative to. See How the heatmap colours work.
- Marketplace limits the figures to one marketplace, or All marketplaces.
- Desc and Asc put the newest or the oldest period first.
- marker 4 Heatmap turns the colours on or off.
- marker 5 Search narrows the table to one product. To see every product again, open it and select Clear.
- marker 6 The tabs choose the figure: Sales, Net proceeds, Units, Refunds, Refund rate, Refund amount, Amazon fees, Cost of goods, Product gross profit, Net profit, Margin, ROI, Sessions, Unit session % and Ad spend.
Read the heatmap
Section titled “Read the heatmap”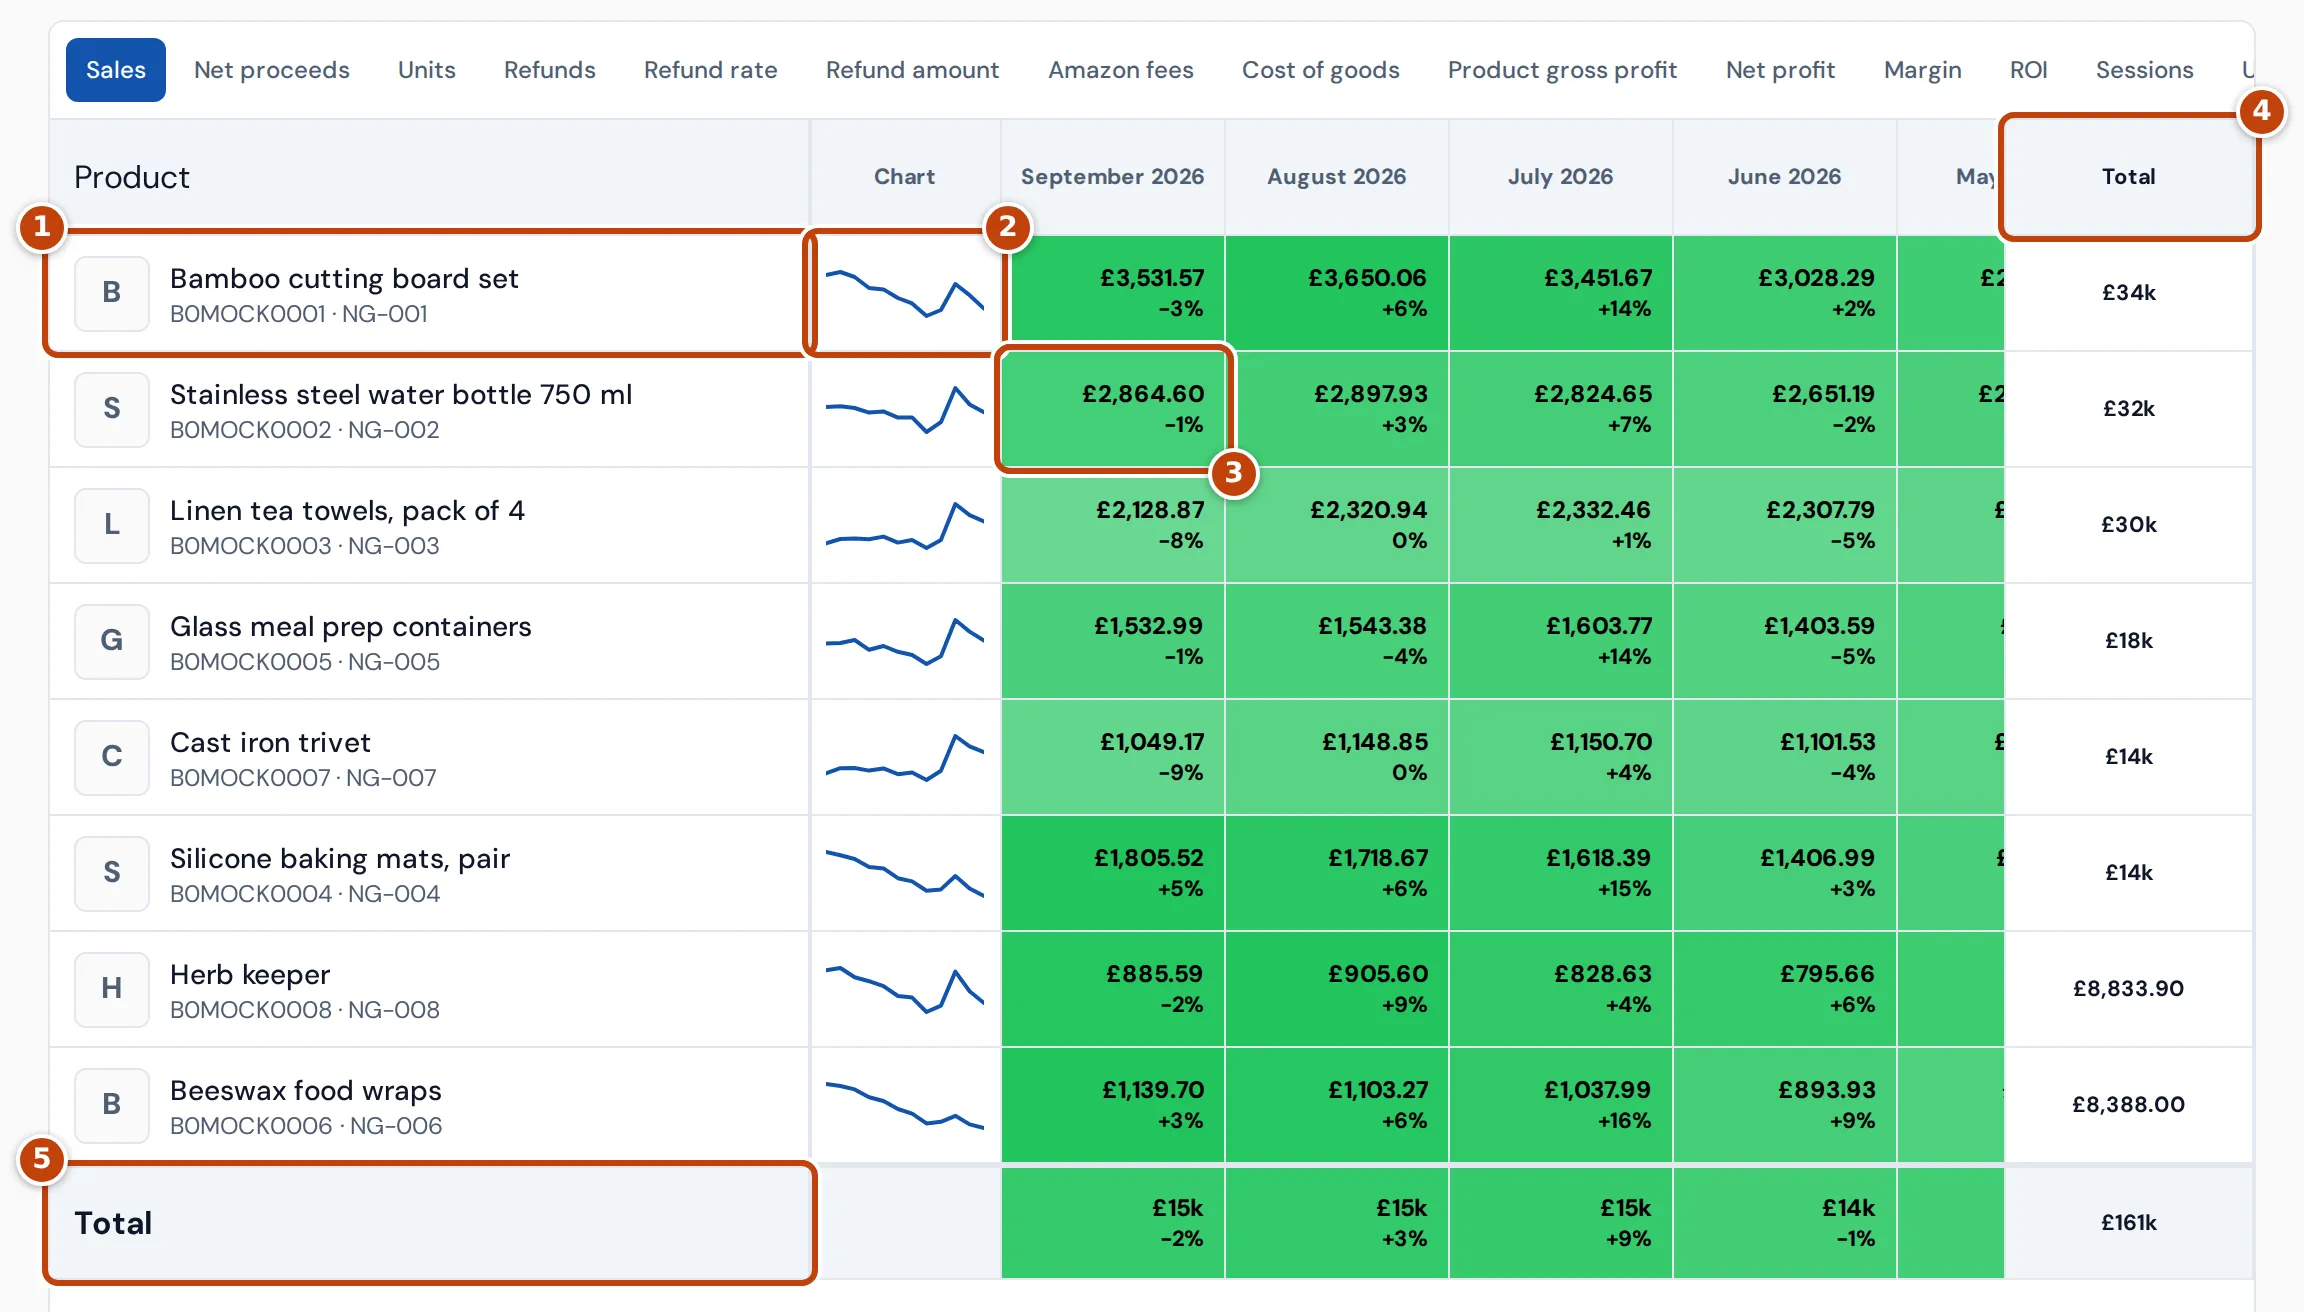
Each row is a product marker 1, with its ASIN and SKU. Listings of the same product are combined into one row. Products are sorted by their total for the period, highest first, and products with nothing to show for the chosen figure are left out.
- marker 2 Chart shows a small line of the product’s figures across the columns. Select it to open a larger chart of the product, with each period’s value when you hover.
- marker 3 Each cell shows the figure for that product and period. The percentage under it is the change from the period before. Hover over a cell to see the product, period and full value.
- marker 4 Total is the product’s figure for the whole period.
- marker 5 The Total row shows each period’s figure for every product that matches the marketplace and Search choices, including products beyond the Rows limit. Rates such as Margin are worked out from the totals, not added up.
Amounts of 10,000 or more are shortened, such as £34k.
How the heatmap colours work
Section titled “How the heatmap colours work”On the Trends heatmap, the colour of a cell shows how large its value is compared with the others, and whether that’s good or bad for the chosen figure:
- For figures where higher is better, such as Sales, Net profit or Margin, large values are green, middling values amber and small values red.
- For figures where lower is better, such as Refunds, Refund rate, Amazon fees, Cost of goods or Ad spend, small values are green and large values red.
- A negative value, such as a loss, is always red.
The stronger the colour, the closer the value is to the largest one it’s compared with. Scale chooses that comparison:
- Row compares each cell with the largest value in the same product’s row, so you see each product’s own ups and downs.
- Global compares every cell with the largest value in the whole table, so you see which products matter most.
What the Trends figures mean
Section titled “What the Trends figures mean”| Figure | What it is |
|---|---|
| Sales | What customers paid for the items, including any VAT in the price. |
| Net proceeds | Sales after VAT and refunds. |
| Units / Refunds | Units sold, and units refunded. |
| Refund rate | Refunds as a percentage of units sold. |
| Refund amount | The value of refunds. |
| Amazon fees | Amazon’s fees, using Amazon’s fee estimate until the actual fee is posted. |
| Cost of goods | The cost of the units sold, from your product costs. |
| Product gross profit | Net proceeds less cost of goods. |
| Net profit | Profit after Amazon fees, advertising and your other costs. |
| Margin / ROI | Net profit as a percentage of net proceeds, and of cost of goods. |
| Sessions | Visits to the product’s pages, from Amazon’s sales and traffic data. Amazon counts sessions per ASIN, so a product sold under several SKUs counts them once. When you pick one SKU, it shows that SKU’s share, split by units sold each day (evenly on days with no sales). |
| Unit session % | Units sold on days with traffic data, as a percentage of sessions. |
| Ad spend | Amazon advertising spend. |
All amounts are in your reference currency, which you set in Settings.
Where the Trends figures come from
Section titled “Where the Trends figures come from”The Trends heatmap follows the P&L’s dates, as the note under the heading says: a sale counts when it ships, and a refund on the date Amazon posted it in its finance data. A month’s figure on Trends therefore matches the P&L page rather than the Dashboard, which counts orders on the day they were placed. See Profit and loss.
Why a Trends cell says “Unresolved” or the table is empty
Section titled “Why a Trends cell says “Unresolved” or the table is empty”- Unresolved in a cell means Crateworth can’t work out the figure without guessing, because something it needs for that product and period is missing: a product cost, an Amazon fee or fee estimate, a VAT rate or an exchange rate. A missing cost leaves Cost of goods and the profit figures blank; add the product’s cost on the Costs & COGS page. See Costs & COGS.
- Figures are updating. Showing the last completed snapshot. means Crateworth is refreshing the figures. The table shows the last complete ones until it finishes.
- Trends unavailable means the figures couldn’t be loaded. If it says Analytics rollups are still updating for this period., the figures for that period are still being prepared. Select Retry to try again later.
- No trends data means no product had anything to show for the chosen figure, period and marketplace.