
Inventory and profitability software for Amazon sellers
Know what you’re making.Know what to reorder.
Bring your Amazon sales, product costs, stock and purchase orders together, so you can see what earns money and what needs attention next.
In development. Every screen on this page shows sample data.
What Crateworth does
From the factory order to the profit on each sale.
Accurate profit analytics with FIFO accounting
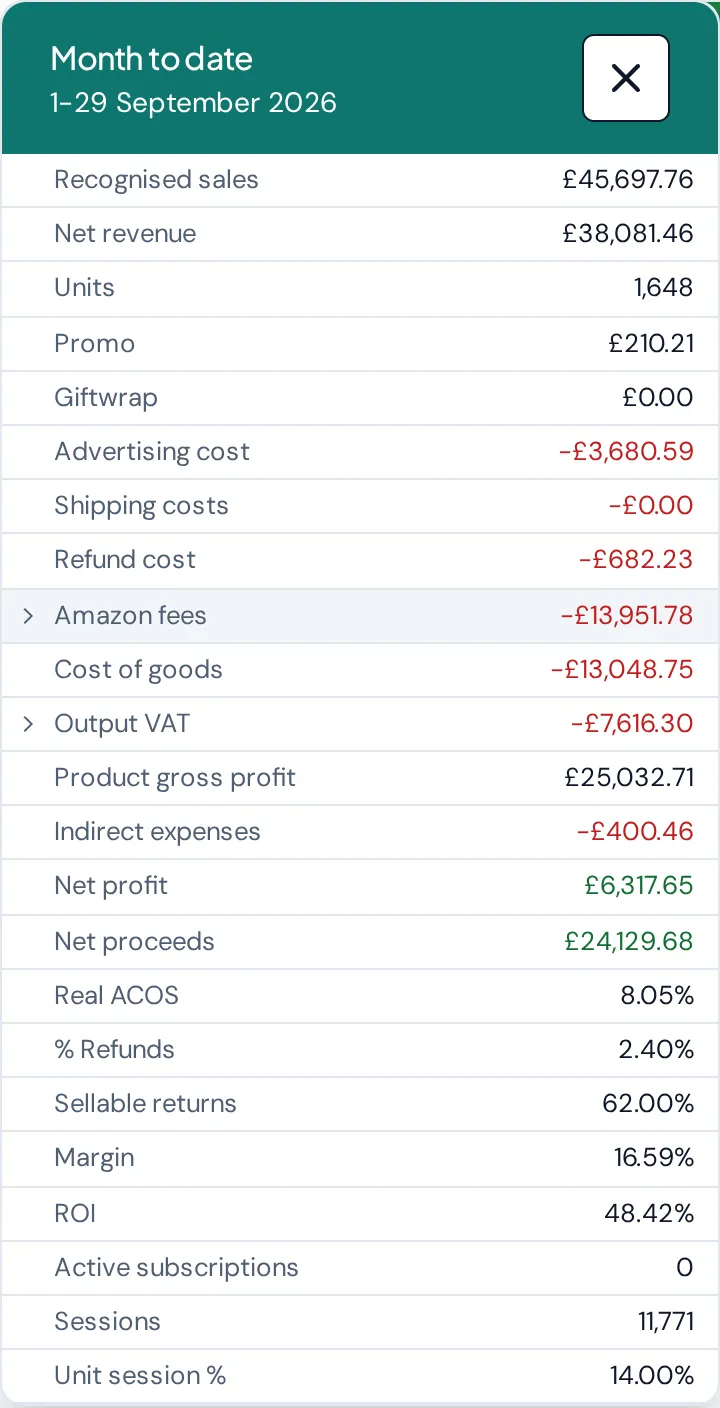
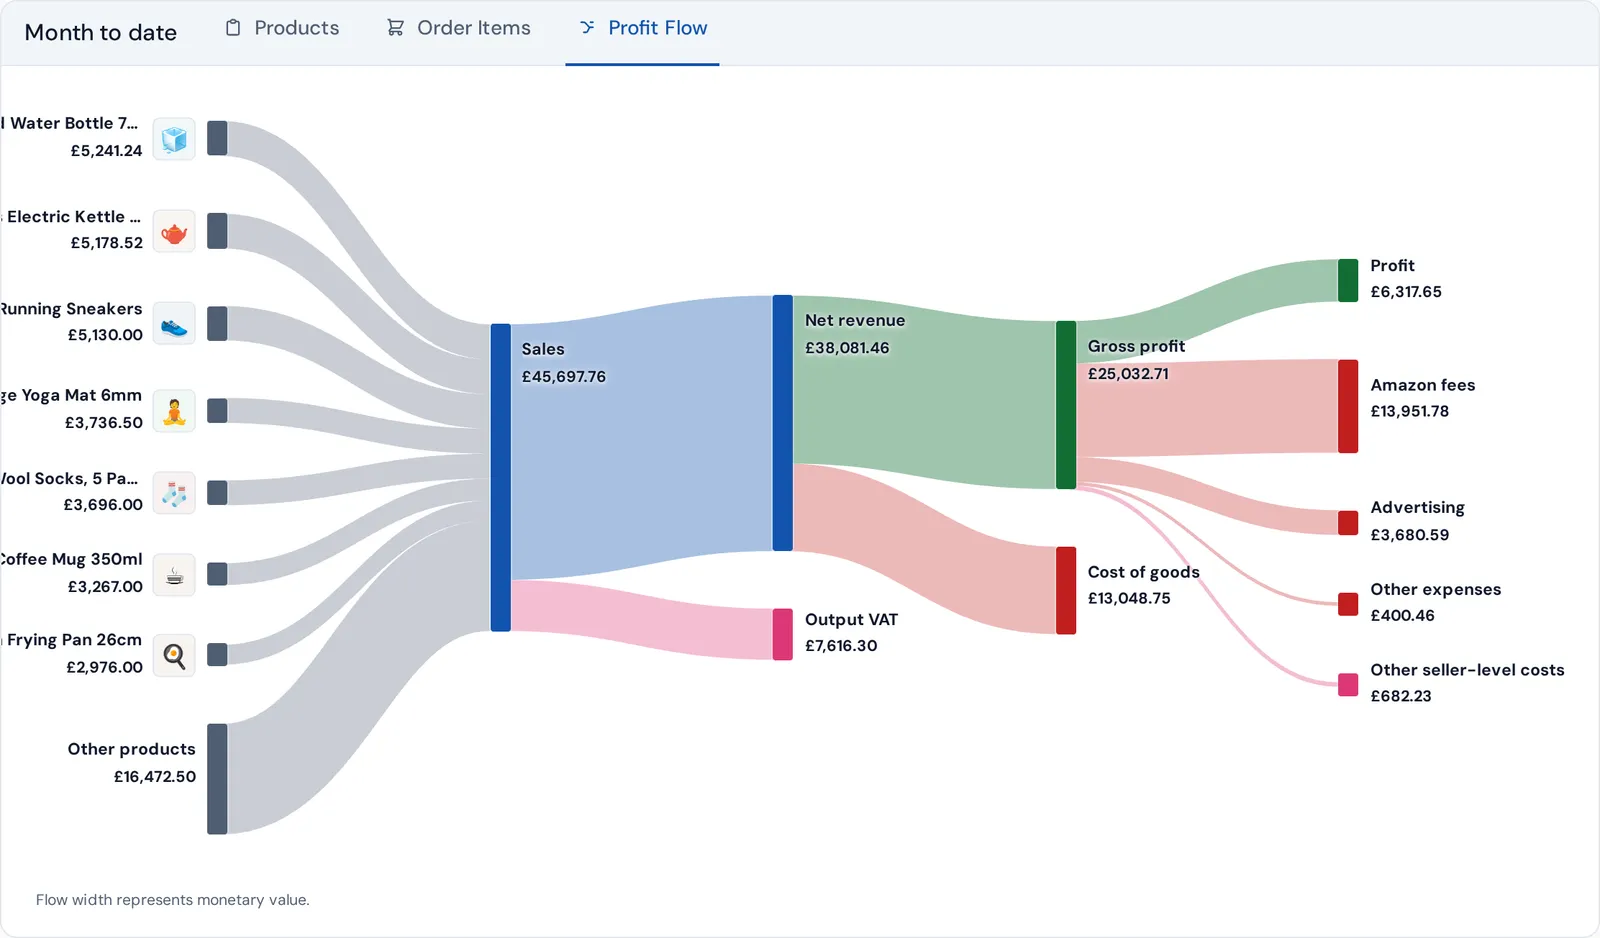
Each sale is costed from the batch it shipped from, then Amazon fees, advertising and VAT come off, so profit per product is the real figure.
How profit is worked out- Sample data
Track your global supply chain
Purchase orders, sea freight and Amazon receiving in one pipeline, with a late shipment flagged next to the stock it puts at risk.
Follow an order 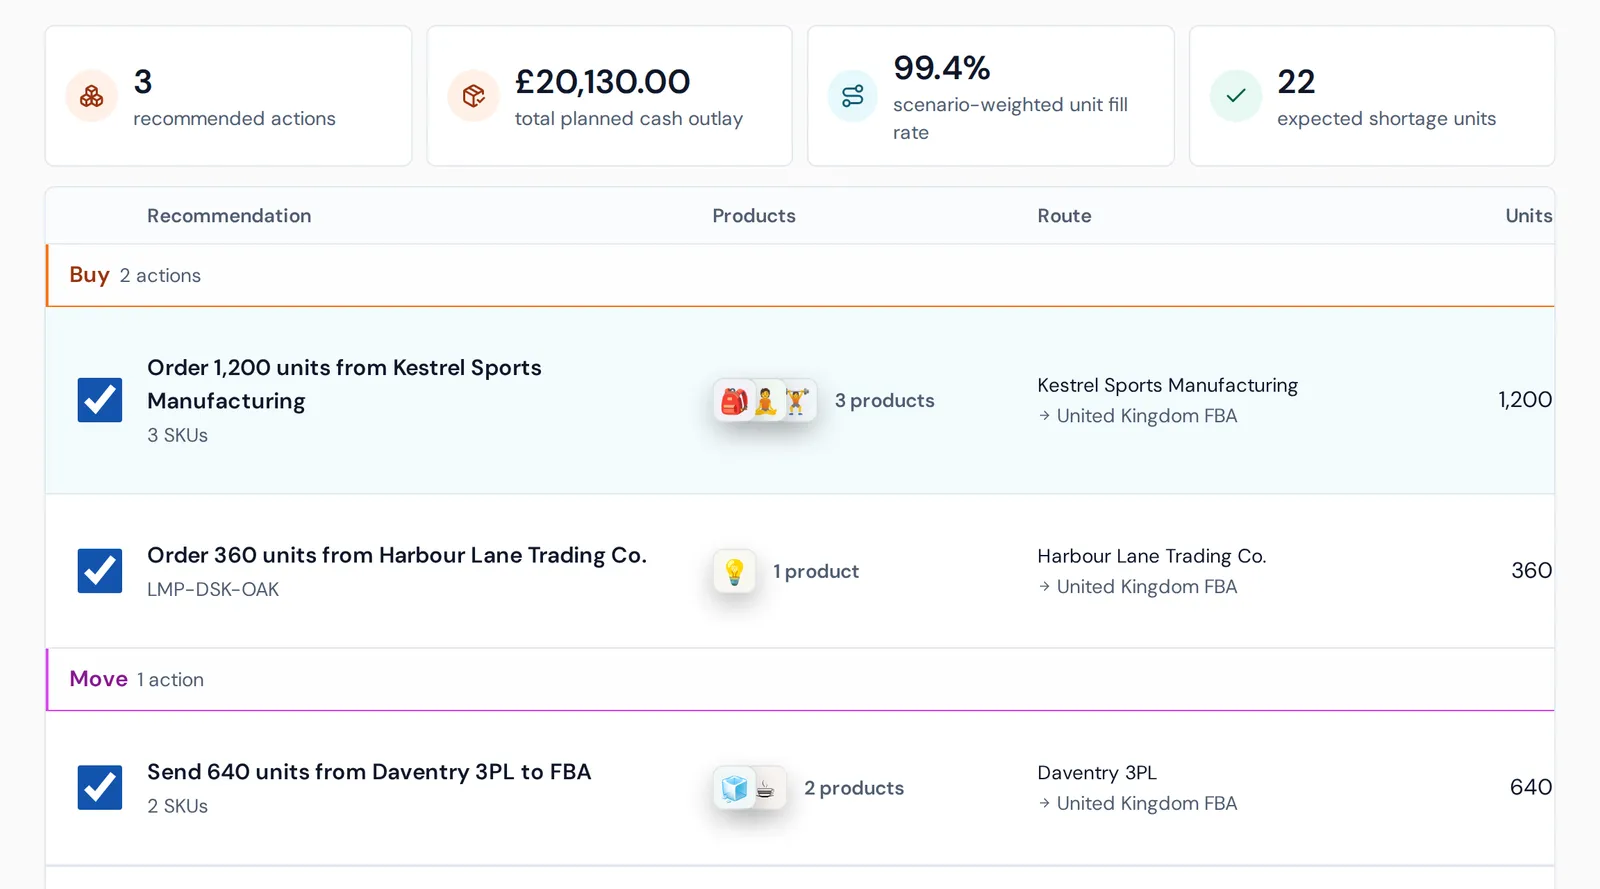
Plan and predict your next purchase order
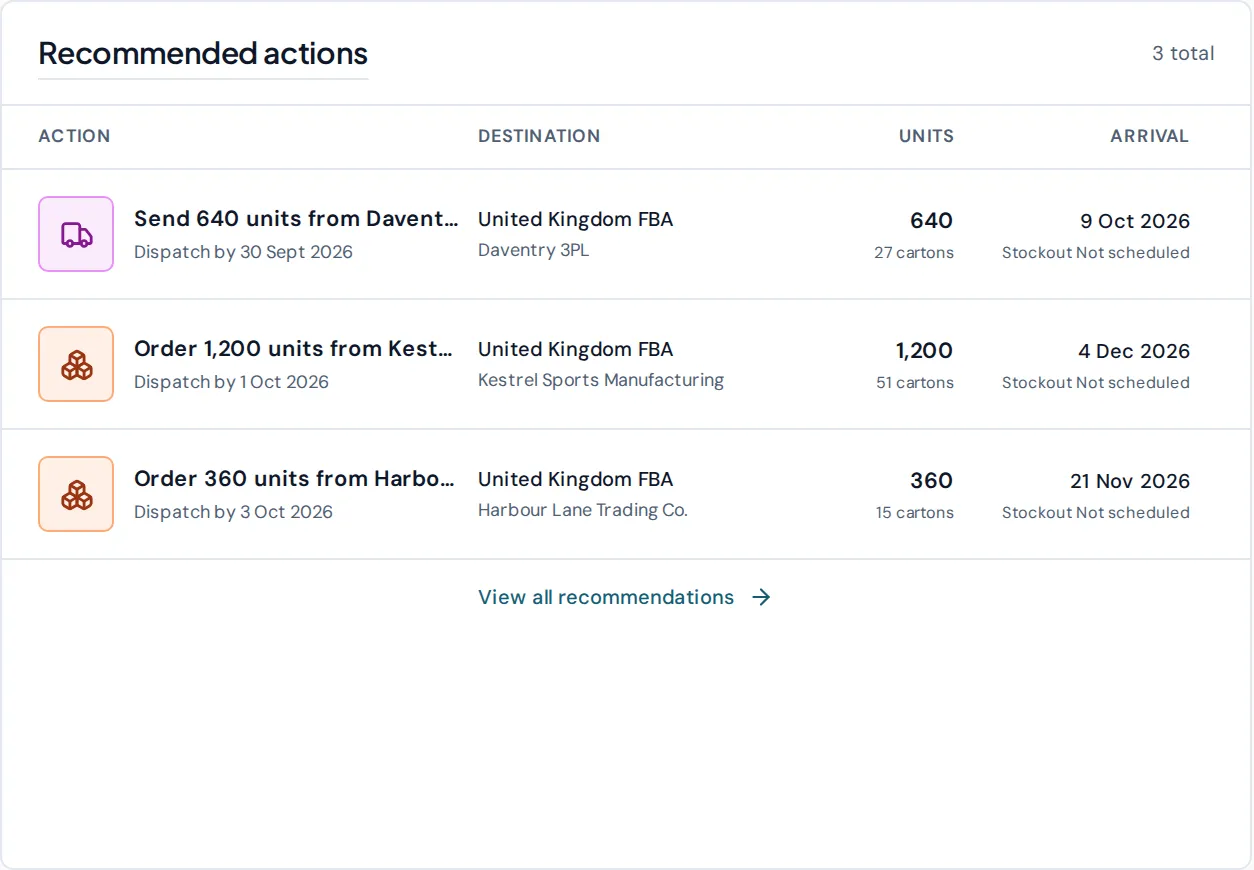
The planner reads sales against stock and what is already on its way, then says what to order, from which supplier, and when.
See the planner- Sample data
Visualise your business
Where your orders go, how Amazon moves your stock and how a container will be packed, on maps and 3D plans that play back day by day.
See the maps
What is making money?
See which products actually earn their place.
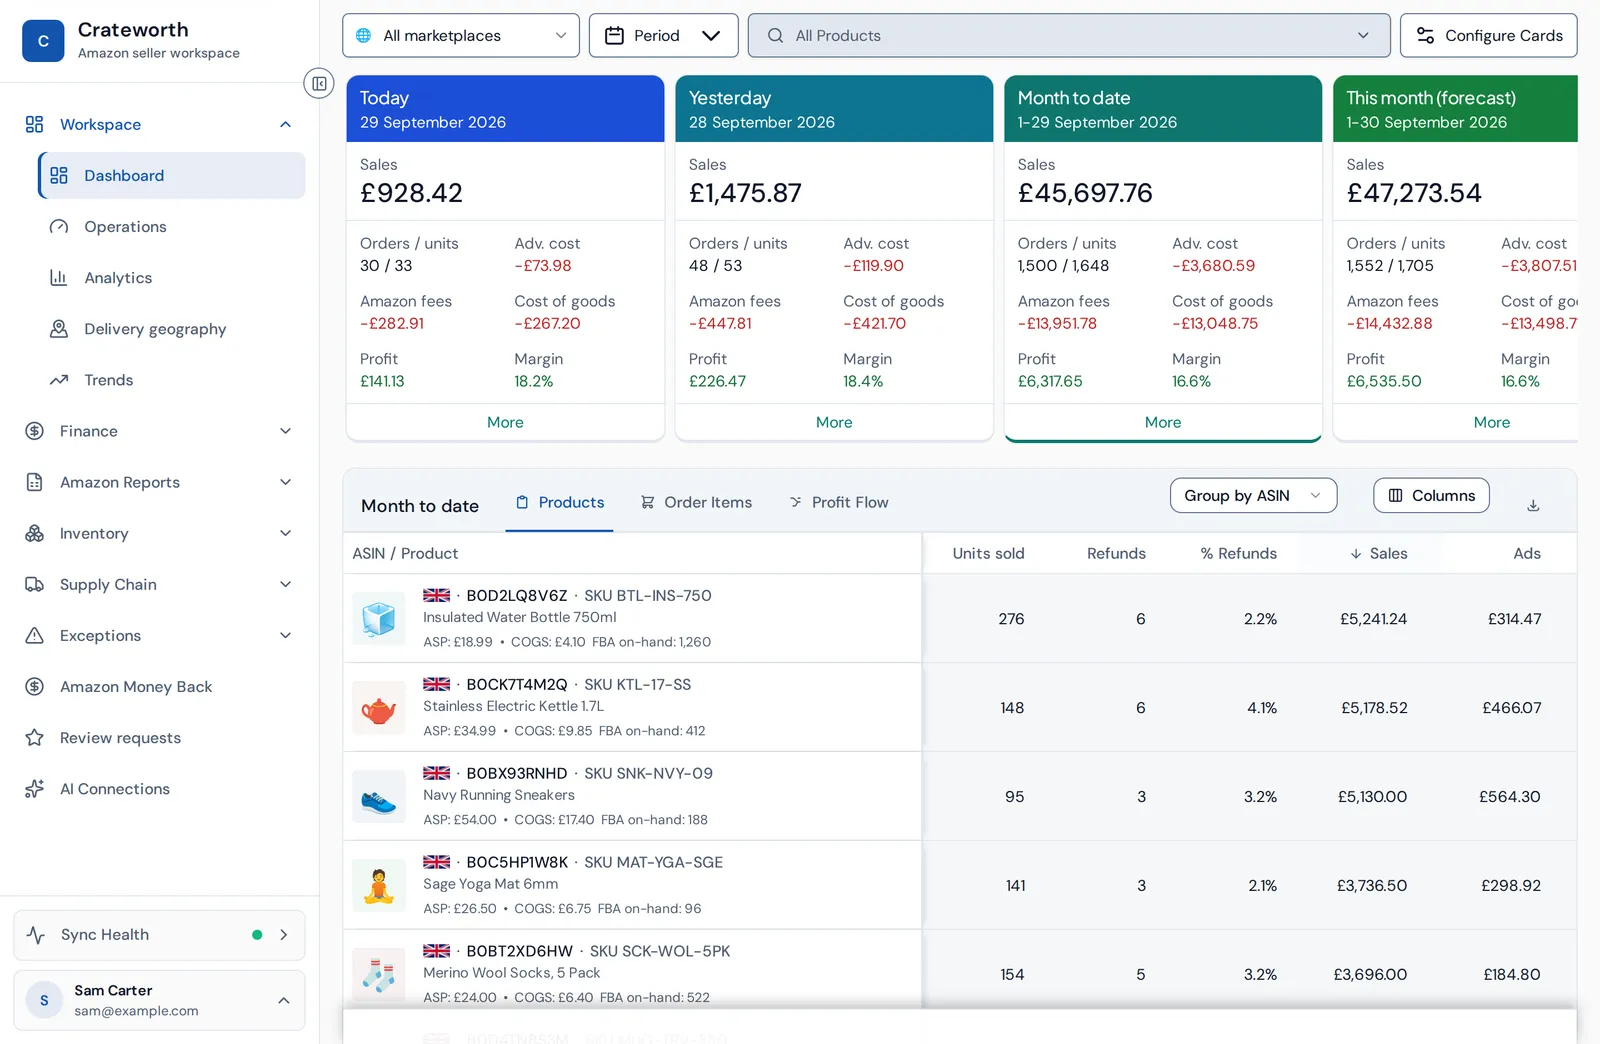
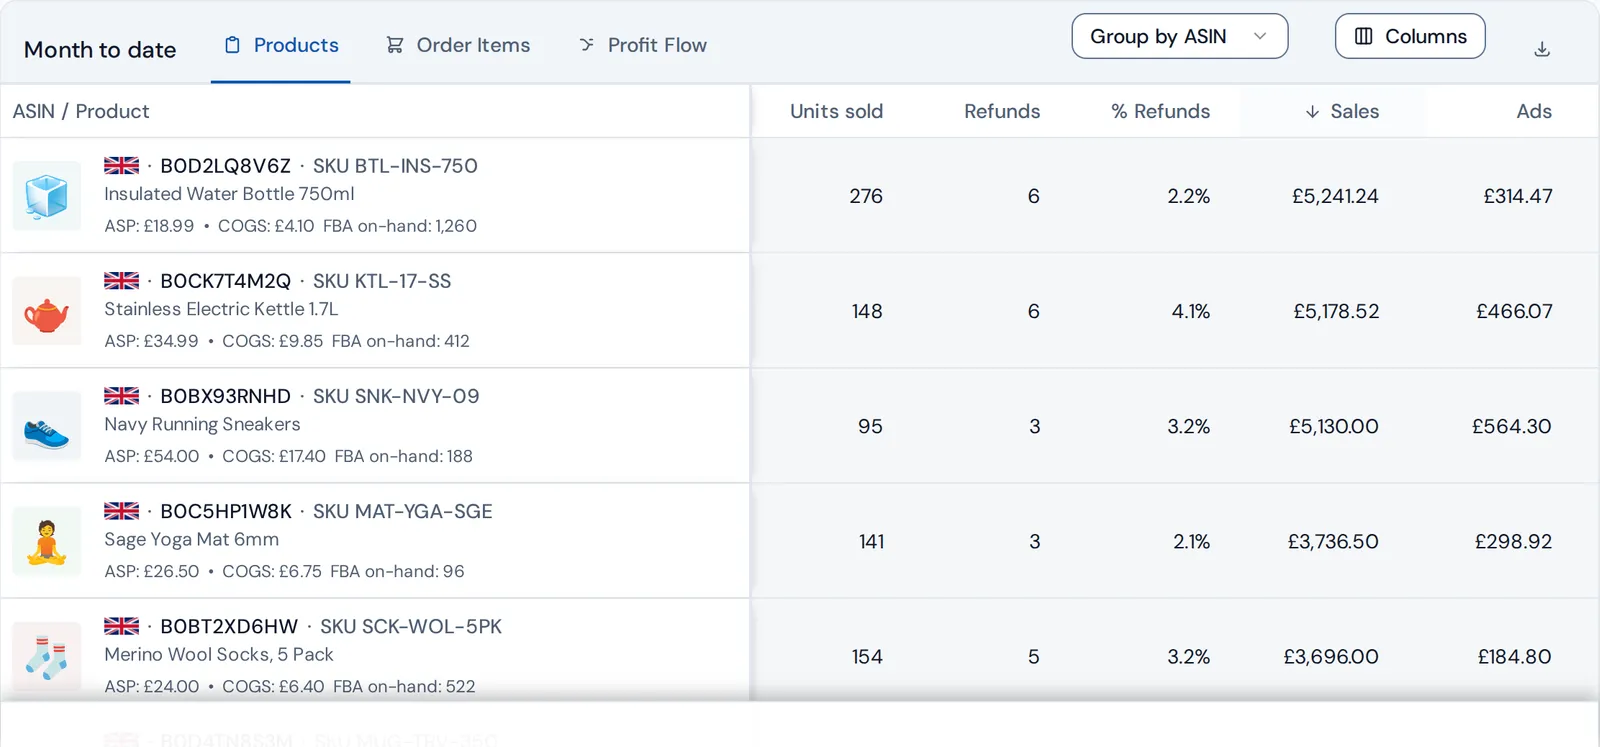
Crateworth takes each product’s sales and subtracts Amazon’s fees, advertising, refunds, VAT and the product costs you enter. What is left is profit by product, by marketplace and by period.
Every figure opens up
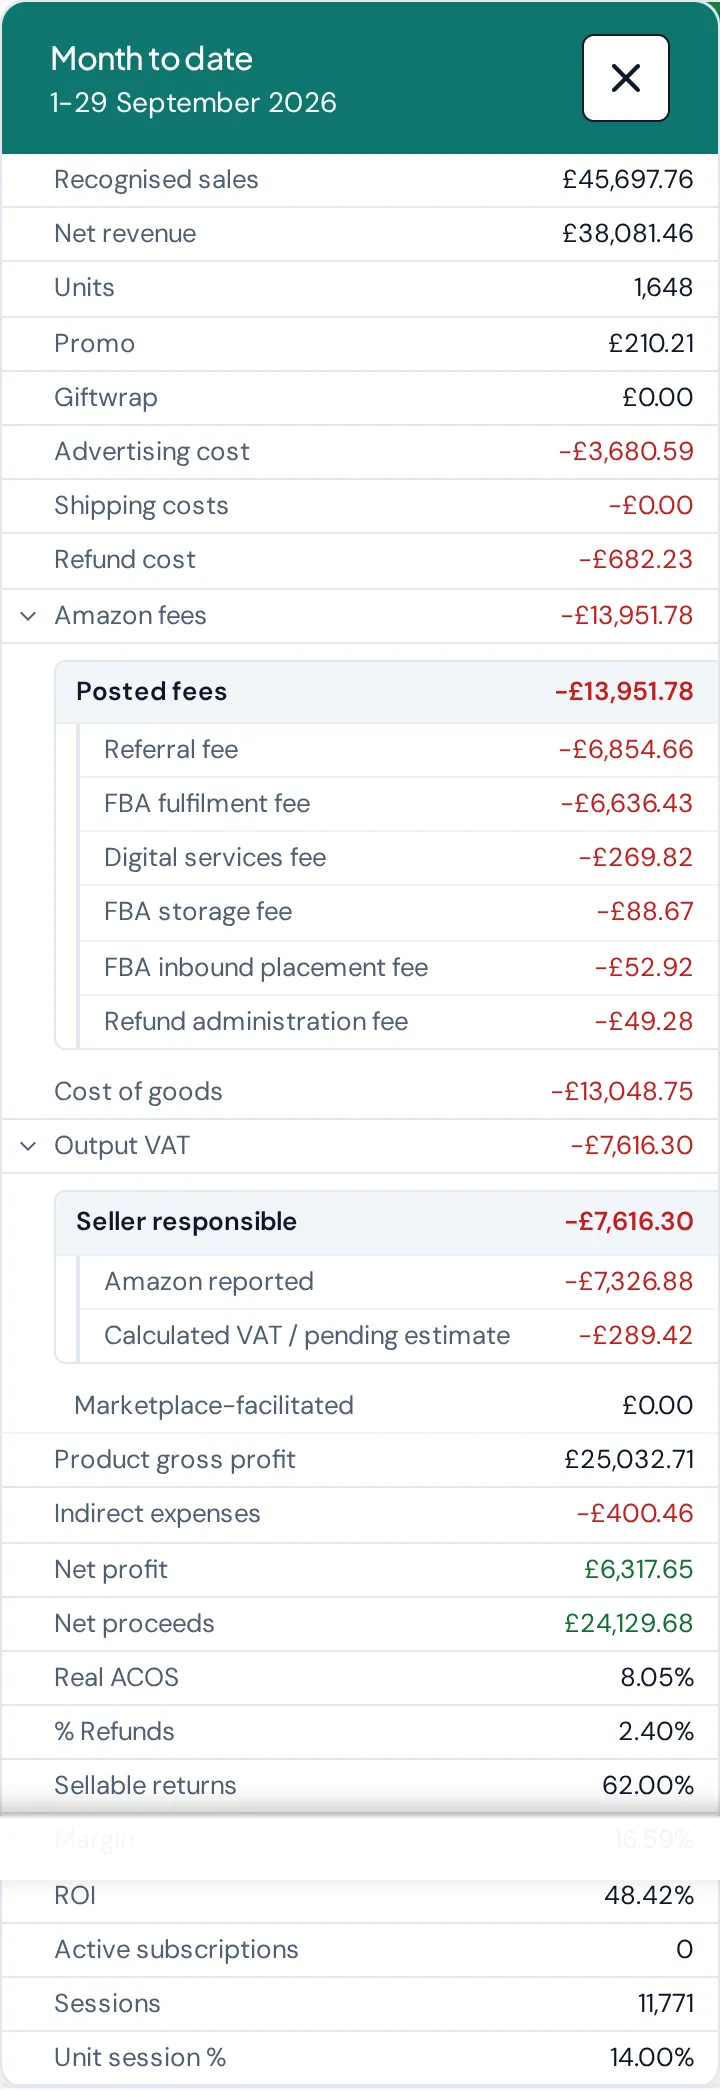
Amazon fees break down into referral, fulfilment, storage and the smaller charges that are easy to miss. Nothing is a single unexplained total.
Estimates say so
VAT and fees that Amazon has not reported yet are calculated and shown on their own line, apart from the reported amounts.
A dash, never a guess
If a product has no cost entered, its profit shows as a dash until you add one. Crateworth does not fill gaps with zero.
What did it really cost?
Cost of goods, down to the day each payment left your bank.
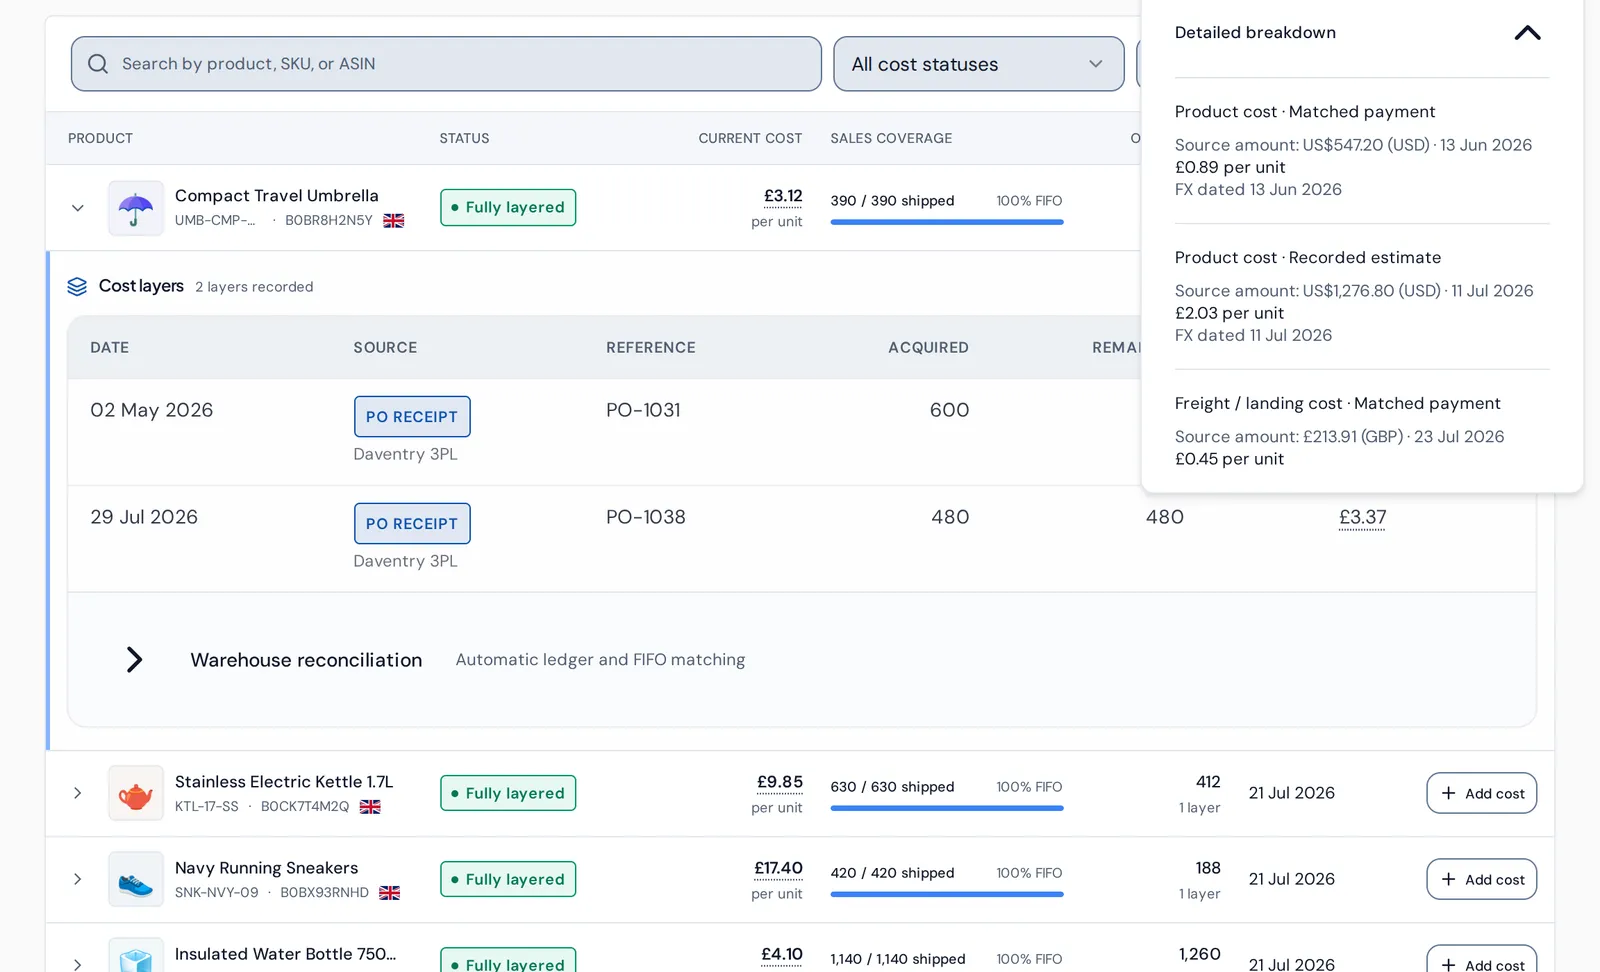
A supplier invoice in dollars is not one number in pounds. Crateworth converts each payment at the rate on the day it was made, adds freight and duty to the units they arrived with, and swaps its estimate for the real amount once the bank line is matched.
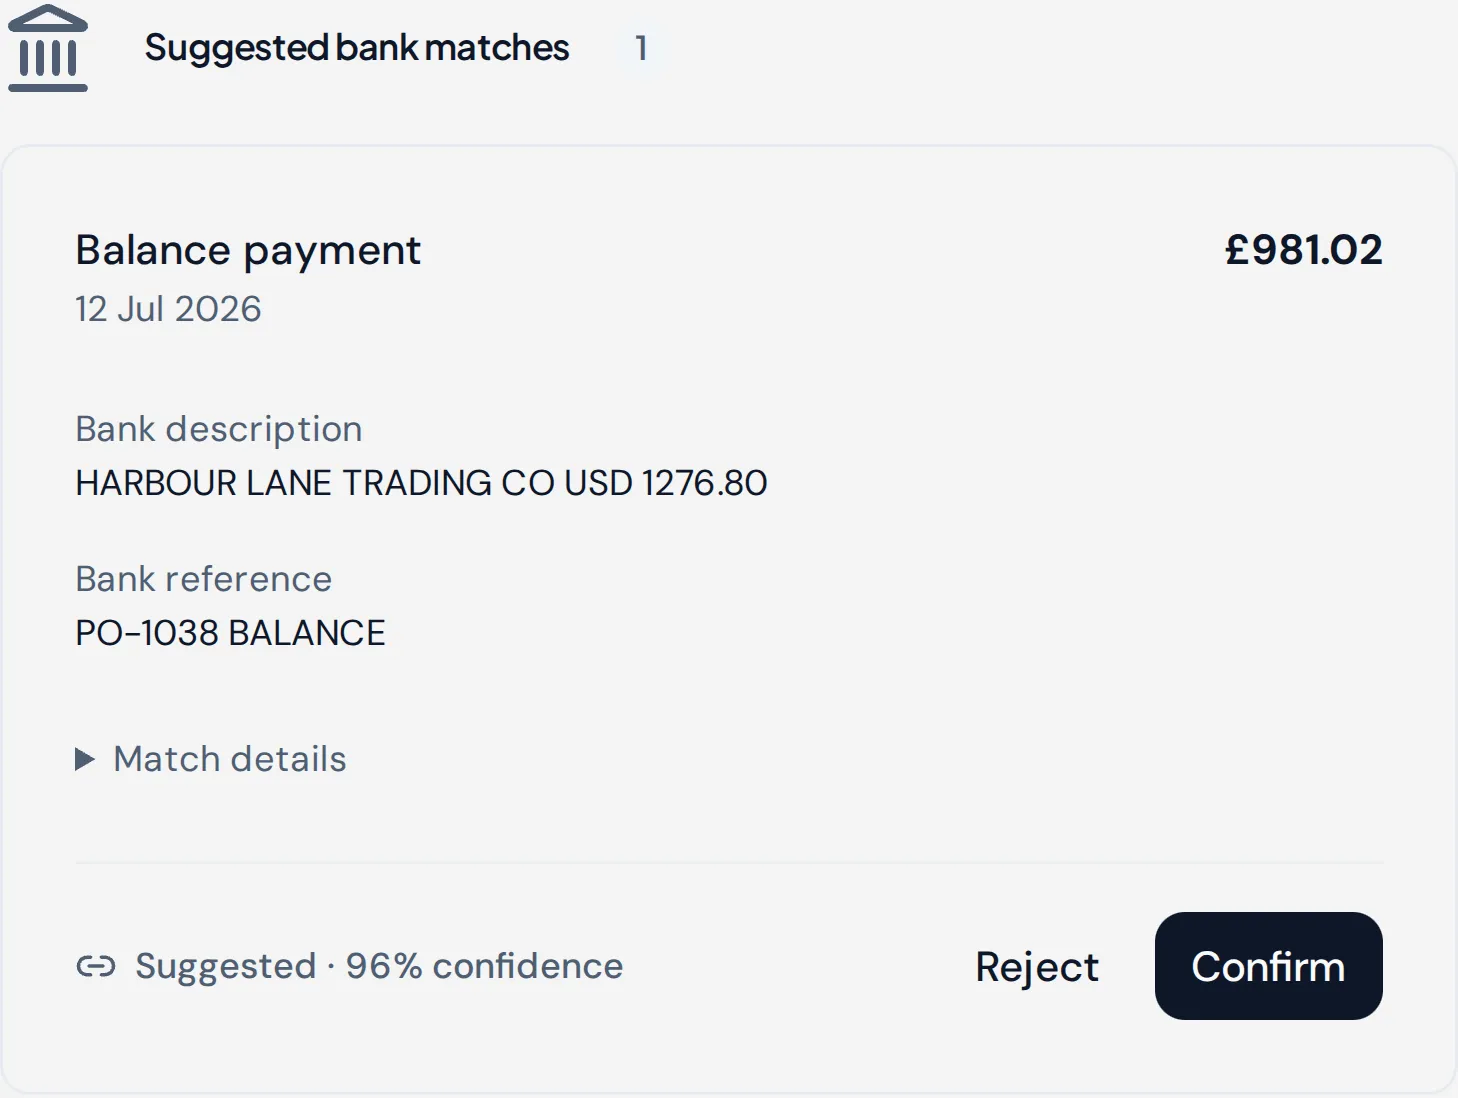
The bank line settles it
Upload a bank CSV and payments are suggested against the orders they pay. Confirm one and the estimate is replaced by what actually left your account, and cost of goods is recalculated for stock already sold from that order.
What is running out? What should I buy next?
Know what needs reordering before it becomes a problem.
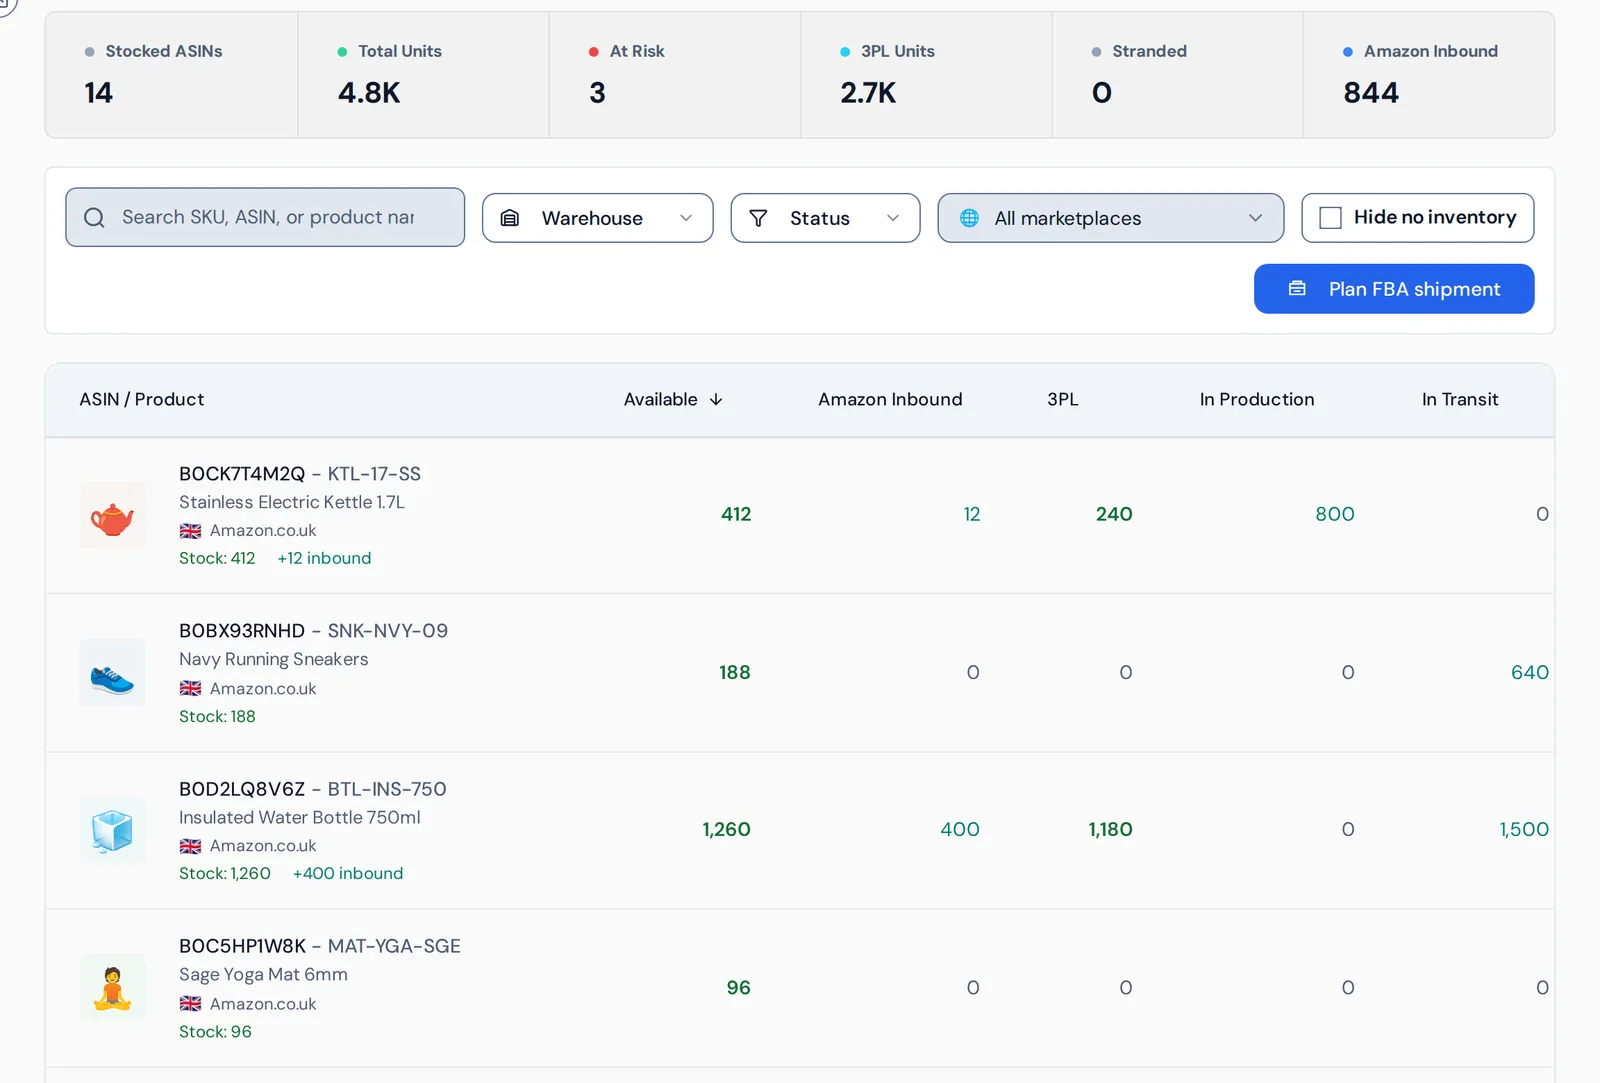
Stock at Amazon, stock at your 3PL, units in production and units on the water sit in one table. The planner reads them against how fast each product sells and how long your supplier takes.
Charcoal Backpack 22L Sample data
- On hand at Amazon
- 61
- Selling a day
- about 2
- Cover left
- 27 days
- Supplier lead time
- 60 days
Next actionOrder 480 from Kestrel Sports Manufacturing now, with two other products from the same supplier.
Where is my inventory?
Follow stock from purchase order to available inventory.
One order of umbrellas, followed from the supplier to the shelf. Each stage below is the same record in Crateworth, a few weeks further on.
Supplier
Harbour Lane Trading Co. is set up once, with its currency, payment terms and lead time.
- Supplier
- Harbour Lane Trading Co.
- Currency
- US dollars
- Terms
- 30% deposit
- Lead time
- 45 days
Purchase order
The order records what was bought and what it cost, in the supplier’s currency and in pounds.

Shipment
Freight is tracked against its expected date. A late arrival is flagged with the units it affects.

Received at Amazon
As Amazon checks units in, received counts are compared with what you sent.

Available
Stock is on the shelf and counted in cover, and its landed cost feeds the profit figures.

Will it fit?
Plan the load before the goods are made.
Crateworth keeps a carton size and weight for every product. A purchase order can be packed into a container, and a delivery on to pallets, while the order is still a draft.
Pallet visualiser
Pick a pallet size, overhang and weight cap, and compare layer layouts for a carton. The plan lists layers, boxes per layer and how well the pallet is used, and turns so you can check it from any side.
Container load plan
Choose a 20ft, 40ft or high-cube container and see the order packed carton by carton, with cube and payload used. Set priority, stacking and orientation per product, or drag a carton to move it yourself.
Both are planning estimates. Confirm equipment, payload limits and loading with your carrier before booking.
Where, exactly?
Some answers are easier to see on a map.
Deliveries, stock transfers and freight each have a map in Crateworth, and each one plays back day by day. These are recordings of the product.
Where your orders go
Orders by postcode district, building up as parcels leave each fulfilment centre. It works from districts only, never a customer’s address or full postcode.
Where Amazon moves your stock
Transfers between fulfilment centres, replayed a day at a time. Units in transit are shown as in transit, so they are not mistaken for units lost.
Where your container is
A sea shipment’s route from port to port, with the vessel’s last reported position and the date it is due. The same shipment sits in the pipeline above, flagged three days late.
Maps © MapTiler © OpenStreetMap contributors. Great Britain postal boundaries © GeoLytix copyright and database right 2012, containing Ordnance Survey, Royal Mail and National Statistics data © Crown copyright and database right 2012. Northern Ireland postcode districts: NISRA.
Look around before you connect anything.
Three places sellers usually start. The screens are the real product, filled with a sample catalogue. No form, no account.
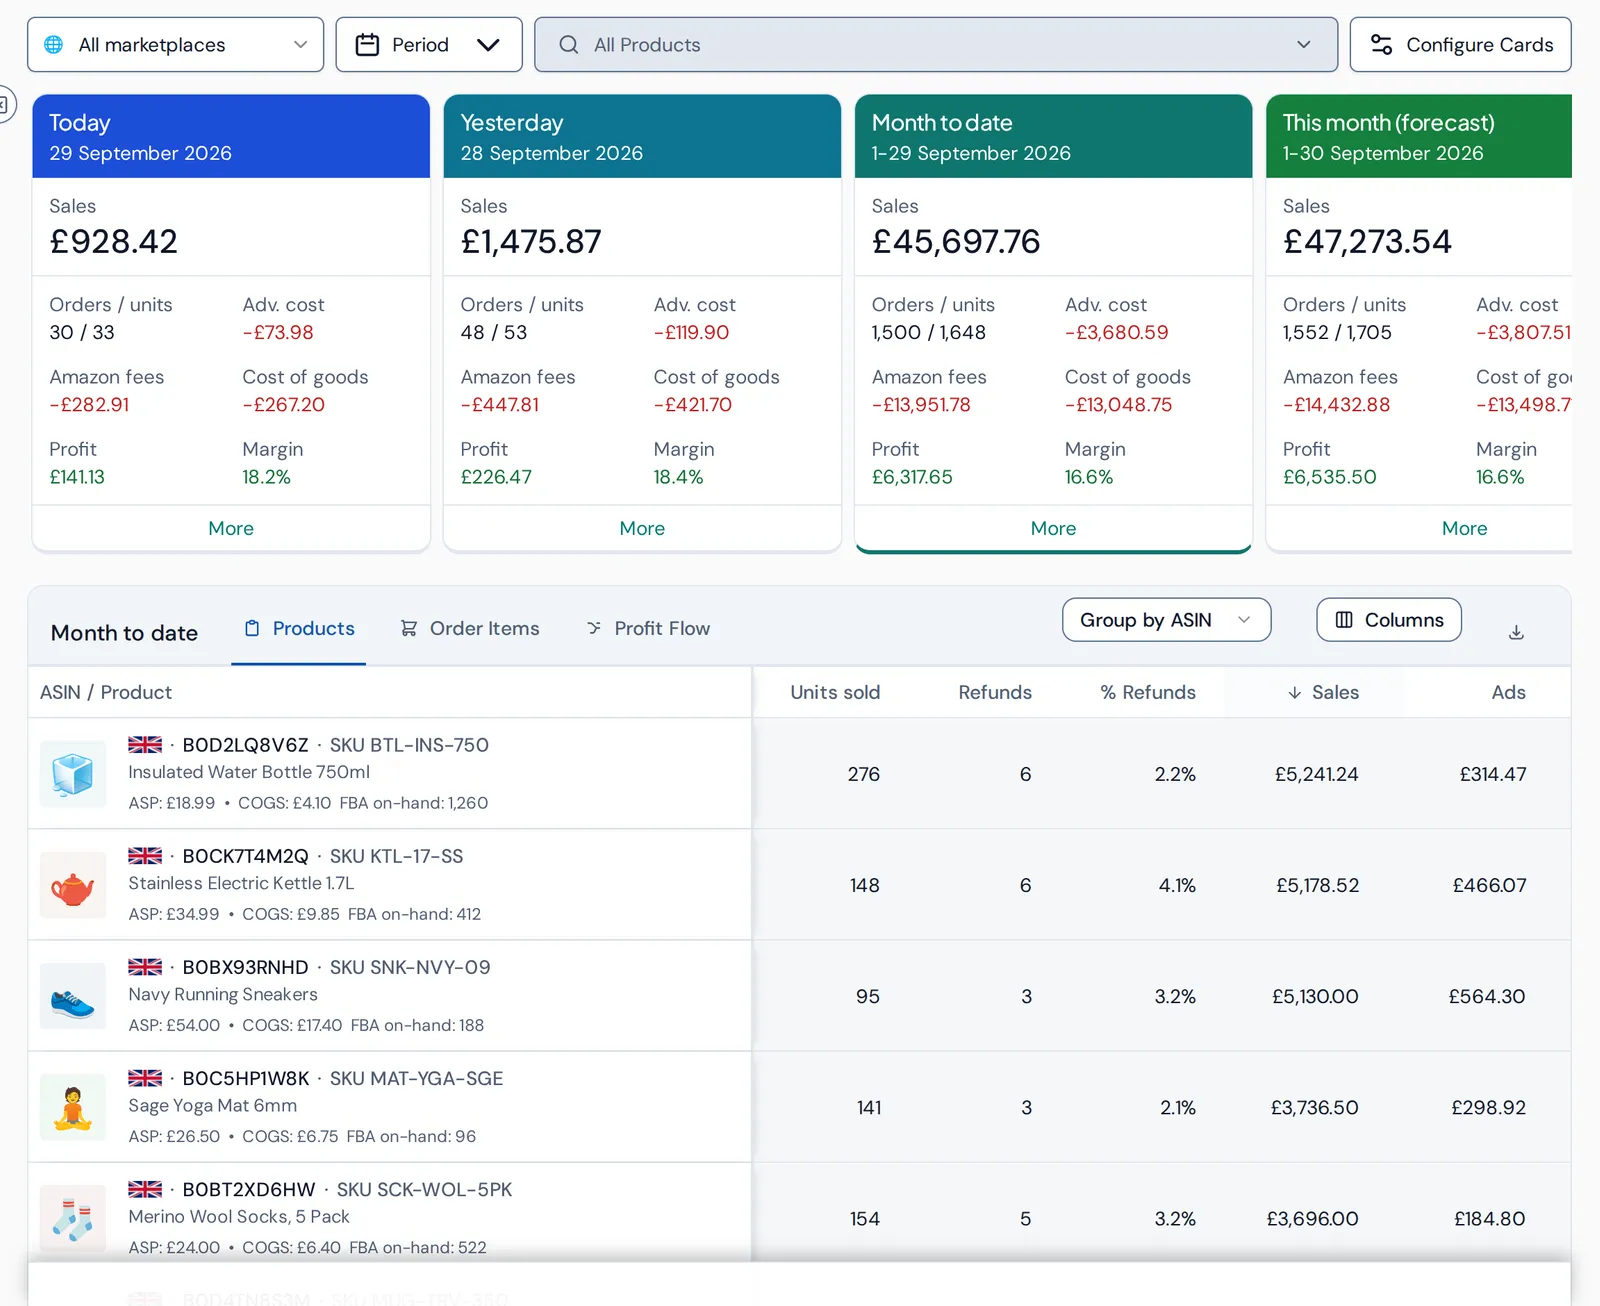
- Profit for the month so far, after Amazon fees, advertising, VAT and product costs.
- Every product shows its average selling price, unit cost and stock on hand.
- Advertising spend sits next to sales, per product, so an expensive best-seller is obvious.
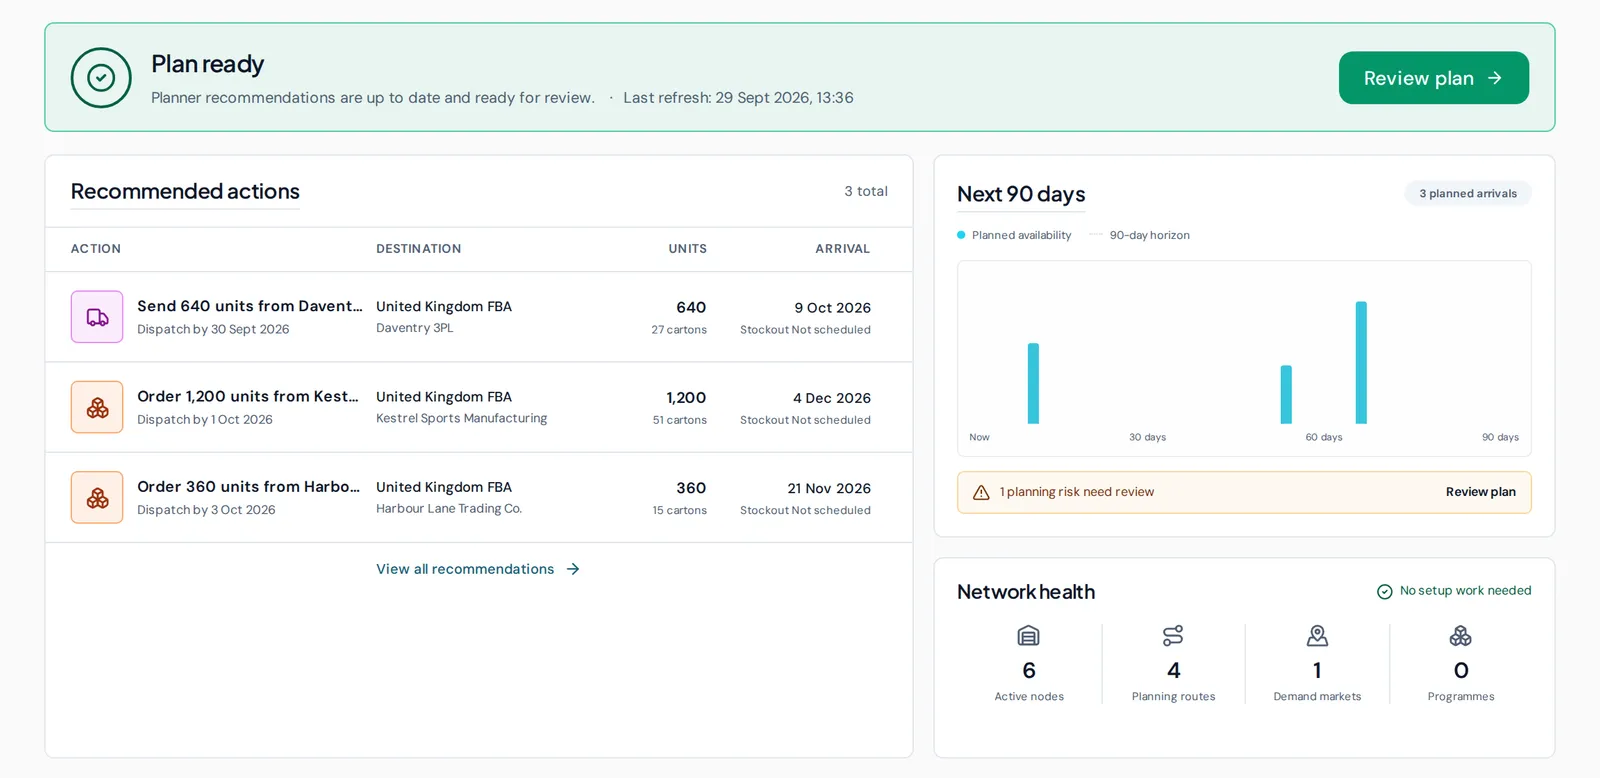
- The plan refreshes as sales, stock and inbound shipments change.
- Each recommendation names the supplier, the quantity and the date to place the order by.
- Planned arrivals over the next 90 days, so you can see when stock lands.
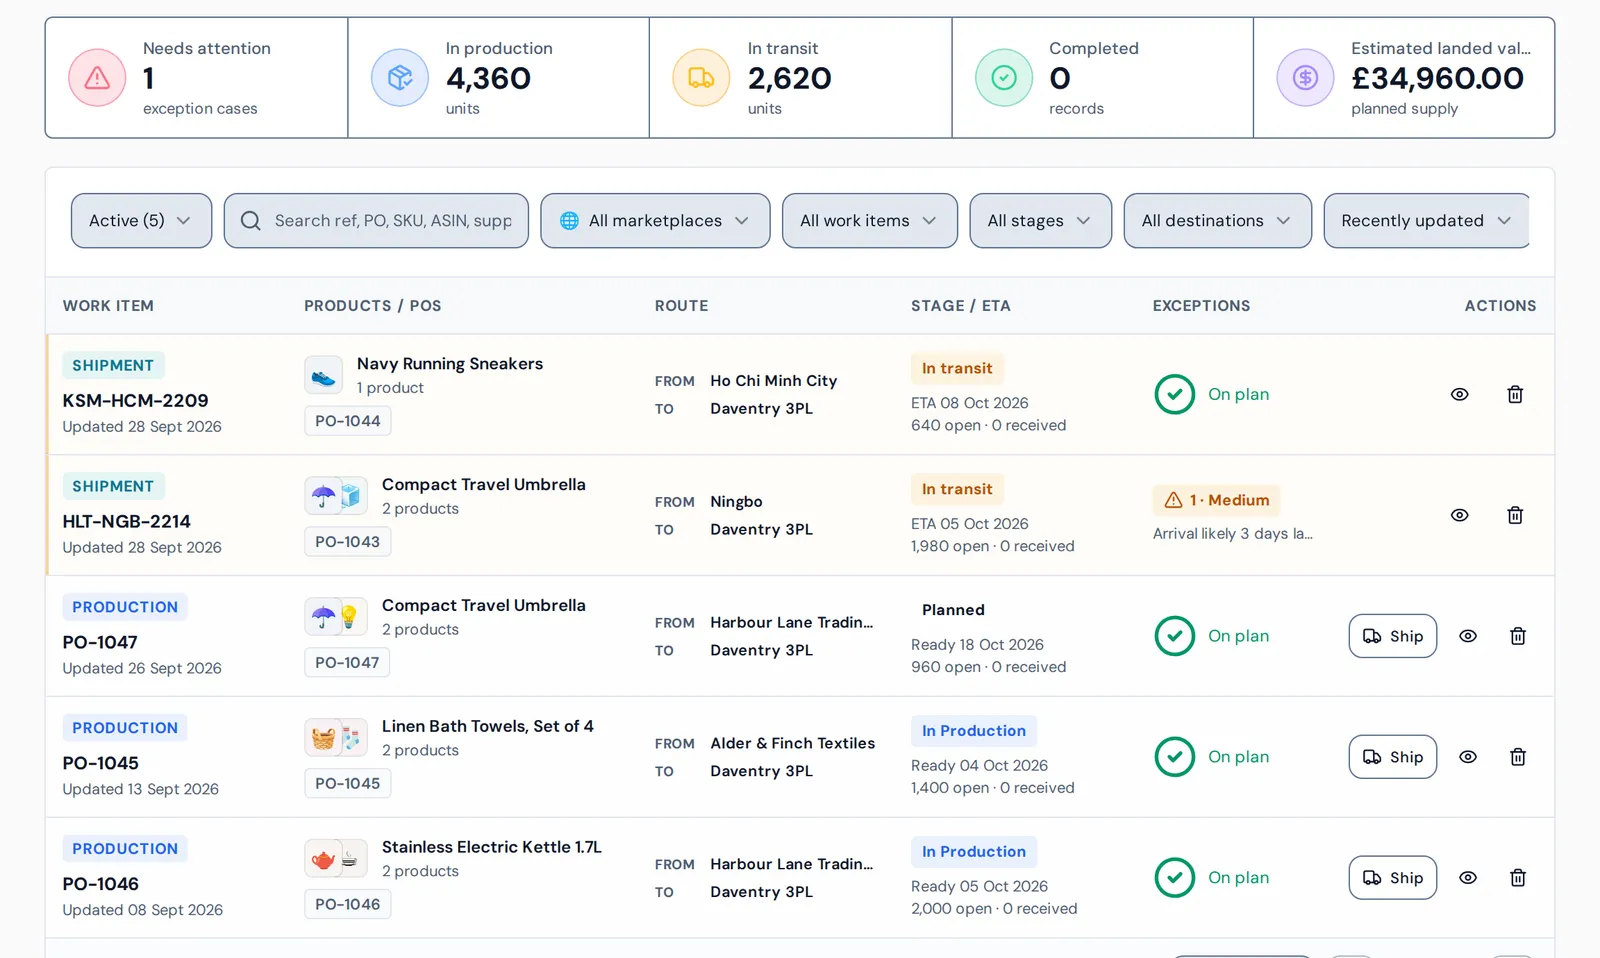
- Units in production and in transit, counted across every open purchase order.
- A shipment running late is flagged with the stock it puts at risk.
- Production orders show when goods should be ready to ship.
What happens when you connect your Amazon account.
Your sales data is commercially sensitive. Here is exactly what Crateworth asks for and what it does with it.
- What you connect
- Your Amazon seller account, approved on Amazon’s own authorisation screen. Crateworth never sees your Amazon password, and you can remove its access from Seller Central at any time. Amazon Ads is a separate, optional connection for advertising costs.
- What Crateworth imports
- Orders, Amazon fees and payouts, FBA stock levels, inbound shipments, returns, reimbursements, removals, storage fees and your listings.
- What you add yourself
- Product costs, suppliers and lead times, purchase orders, stock held at a 3PL or your own warehouse, and business expenses that Amazon does not know about.
- Marketplaces
- Built around UK sellers first. Amazon’s European stores connect alongside the UK, and stores in North America, the Middle East and Asia-Pacific can be connected too.
- How long setup takes
- The last 30 days of orders and fees are designed to load in about 20 minutes. Up to two years of history then fills in behind it, newest first, with a target of 24 hours. Progress is shown per marketplace.
- Permissions requested
- Amazon’s seller roles for Amazon Fulfilment, Finance and Accounting, Inventory and Order Tracking, Pricing, Product Listing, Brand Analytics, Selling Partner Insights and Direct-to-Consumer Shipping. Amazon lists them on the authorisation screen before you approve.
- How your data is handled
- Each business’s records are separated at database level, so one account cannot read another’s. Sign-in supports two-factor authentication. Team members get roles, and profit can be hidden from individual people. Crateworth changes something on Amazon only when you confirm it, such as publishing a listing edit or creating an FBA shipment.
Built by an Amazon seller.
Crateworth started as the tool I needed for my own FBA business. I had Seller Central for orders, a spreadsheet for product costs, another for purchase orders and a supplier’s email thread for where the stock was. None of them agreed with each other.
So the numbers here are built the way I wanted them as a seller: traceable to a source, honest when something is missing, and tied to the decision they are for.
The founder, Crateworth
Pricing
One product. The plan you need depends on how many orders you take a month.
- Free trial
- 30 days, full product
- Card needed to start
- No
- Plans are sized by
- Orders a month, across all your businesses
- Included on the entry plan
- 3 businesses, 3 people
Monthly prices are being finalised and will be published here before launch. You will not need to book a call to see them.
See what needs your attention.
What is earning, what is running low, and what to order next, from the same set of numbers.