
Dashboard
The Dashboard shows your Amazon sales, costs and profit for today and a few recent periods side by side, with the products and orders behind them. It’s the first page you see after signing in. To open it from elsewhere, in the sidebar, under Workspace, select Dashboard.
What’s on the Dashboard
Section titled “What’s on the Dashboard”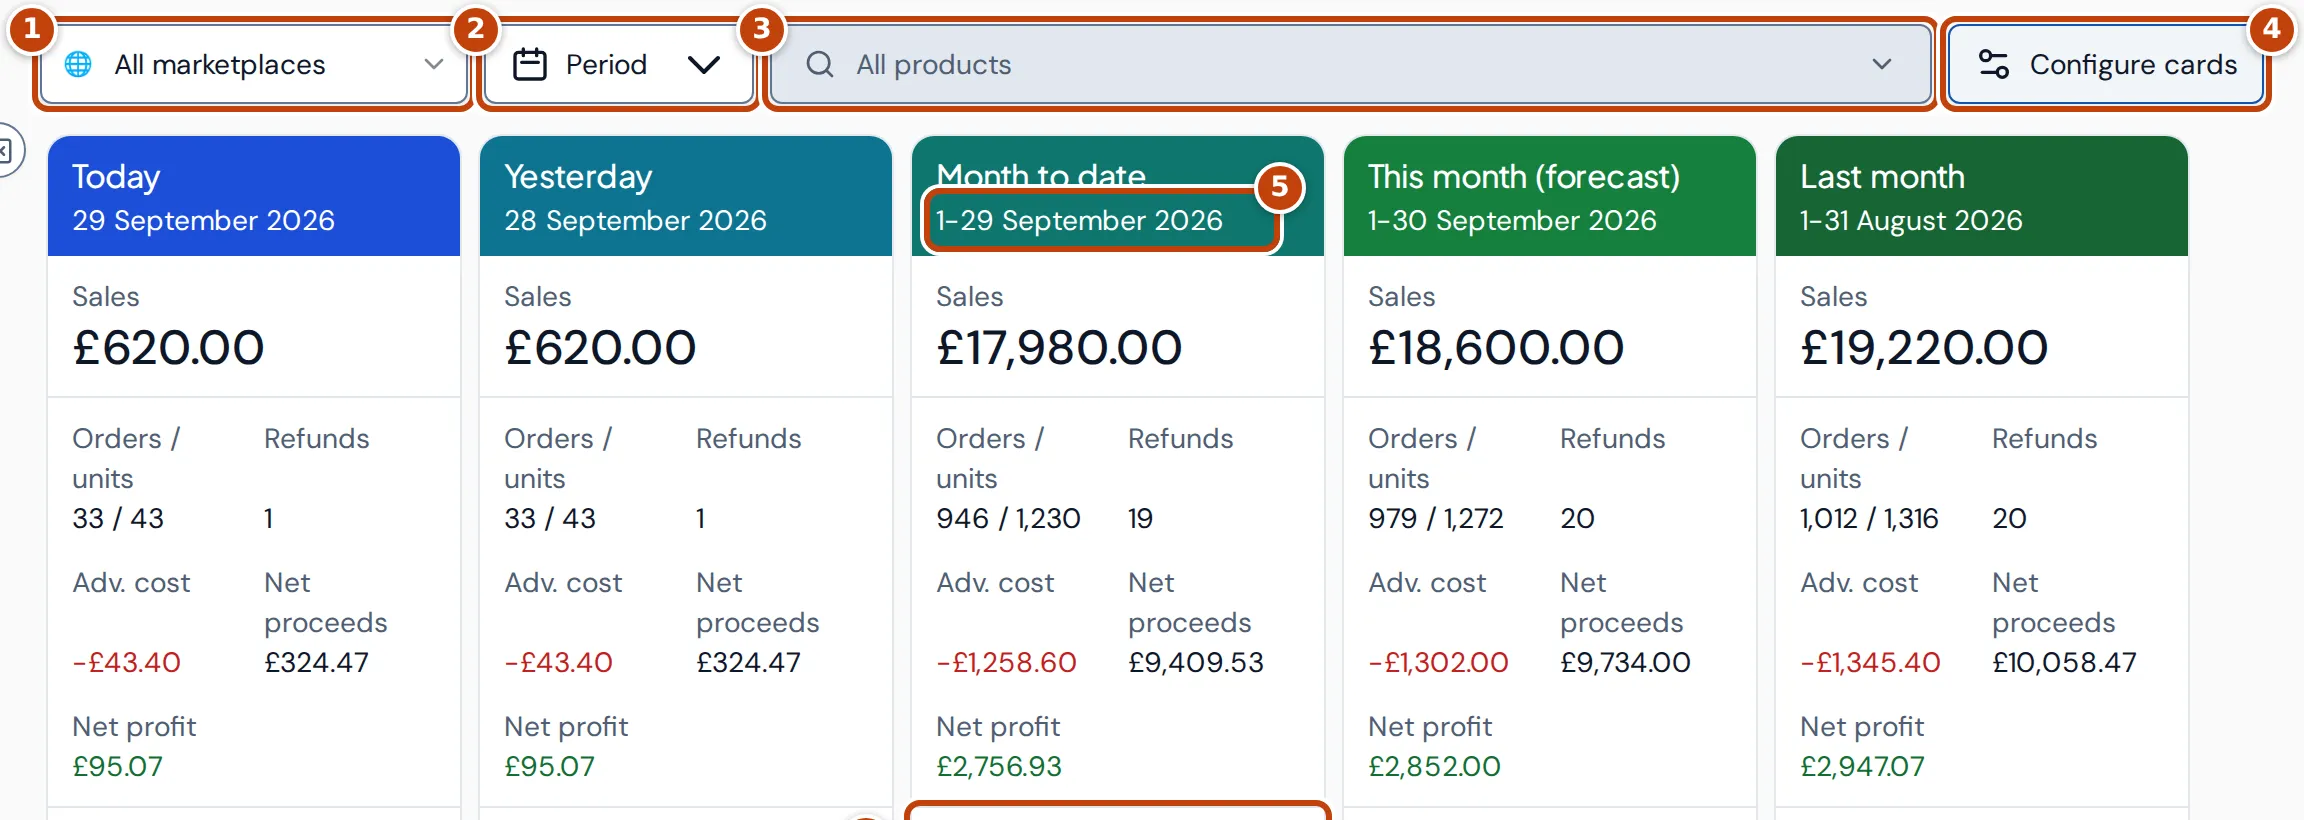
The Dashboard has three parts, from top to bottom. The filters along the top:
- marker 1 All marketplaces chooses a marketplace, or all of them.
- marker 2 Period chooses the set of periods the cards show.
- marker 3 All products narrows the page to one or more products.
- marker 4 Configure cards chooses which figures the cards show.
The period cards, one per period, each with up to seven figures:
- marker 5 The dates under a card’s name change that card’s period.
- marker 6 More opens the full breakdown for that period.
Below the cards, the products and orders for the selected period, on three tabs: Products, Order items and Profit Flow.
Period cards
Section titled “Period cards”By default the Dashboard shows five periods: Today, Yesterday, Month to date, This month (forecast) and Last month. To show a different set, select Period and choose another set of days, weeks, months or quarters, Lifetime or Custom range.
To change one card’s period on its own, select the dates under the card’s name (marker 5 in the screenshot at the top of this page).
Select a card to make it the period for the tables below it. The forecast card can’t be selected, because it isn’t actual data: it scales month to date up to the whole month (month-to-date figures × days in the month ÷ days so far). Percentages on the forecast card are the month-to-date ones.
Compare with an earlier period
Section titled “Compare with an earlier period”To compare each card with an earlier period, select Period and choose an option under Compare with: Previous period, Previous week, Previous month, Same dates last year or Custom comparison period. Tick Align weekdays (364 days earlier) to compare Mondays with Mondays. Each card then shows the comparison value and the change. Green means the change is good for that figure and red means it’s bad, so a fall in costs shows green.
What the card figures mean
Section titled “What the card figures mean”A new Dashboard shows these figures. Use Configure cards to add others, such as Margin, ROI or Amazon fees, from the Metrics library.
| Figure | What it is |
|---|---|
| Sales | What customers paid for the items, including any VAT in the price. Shipping, gift wrap, cancelled orders and non-Amazon (multi-channel) orders are left out. |
| Orders / units | Orders placed in the period, and the units in them. |
| Refunds | The number of refunds Amazon posted in the period. |
| Adv. cost | Amazon advertising without VAT, plus advertising recorded in your expenses. Amazon’s comes from the Amazon Ads reports and, for days they don’t cover (such as before you connected Amazon Ads), from the advertising invoices in your Amazon payments. |
| Net proceeds | Sales after promotions, VAT, refunds and Amazon fees, before your other costs. It isn’t a payout forecast. |
| Net profit | Net proceeds less cost of goods, advertising, shipping and your other expenses, adjusted for Amazon reimbursements and inventory write-offs. |
Margin is profit divided by net revenue (sales after VAT and refunds), not by sales. ROI is profit divided by cost of goods.
See the full breakdown for a period
Section titled “See the full breakdown for a period”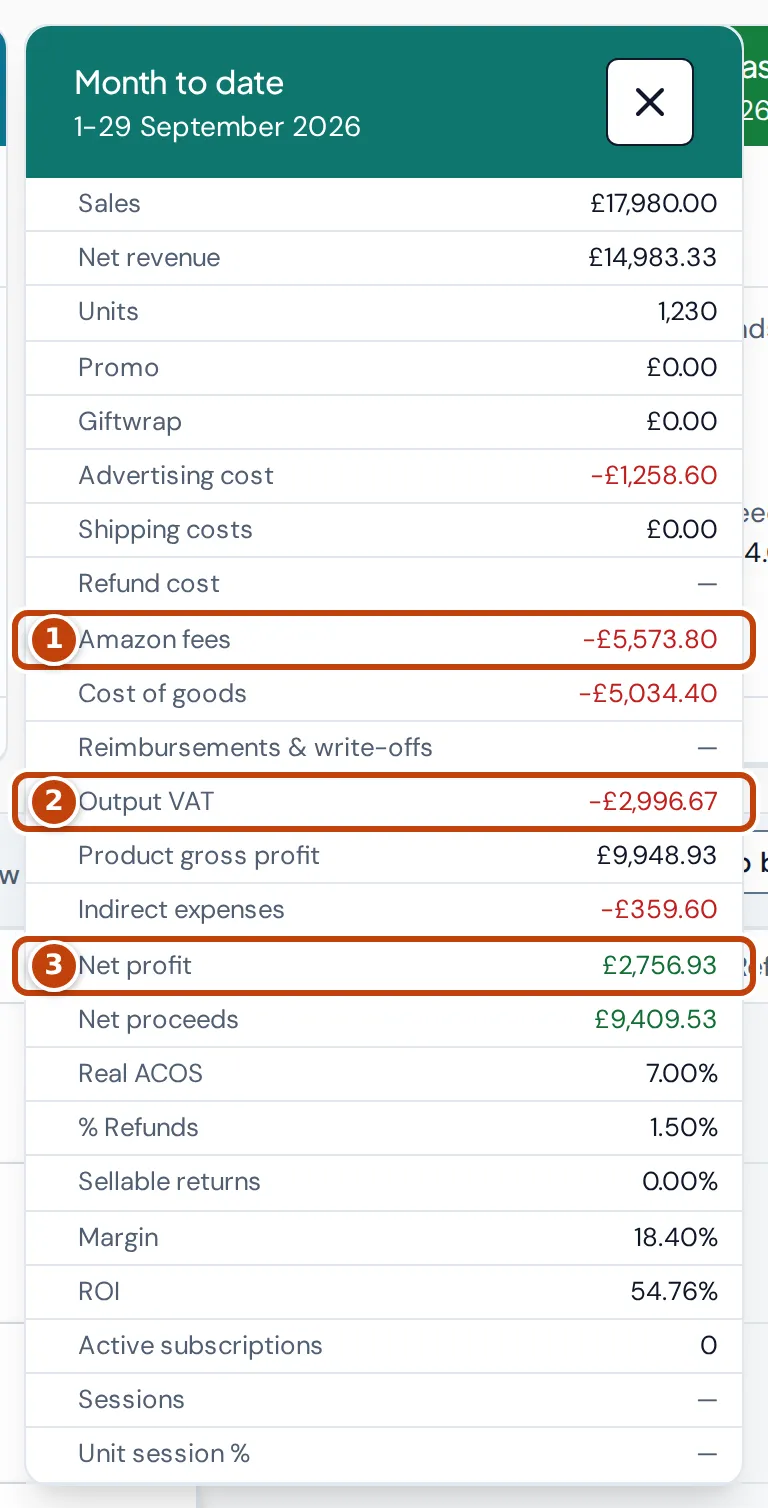
Select More on a card to open its breakdown. It lists every figure behind the card’s profit: sales and net revenue, advertising and shipping costs, Amazon fees, Cost of goods, Reimbursements & write-offs, Output VAT, Product gross profit, Indirect expenses and Net profit, then ratios such as Real ACOS, Margin and ROI.
Rows with an arrow expand:
- marker 1 Amazon fees splits into posted fees and Estimated fees, so you can see how much of the period’s fees are still estimates.
- marker 2 Output VAT shows which VAT you owe and which Amazon collected.
- Reimbursements & write-offs splits into Amazon reimbursements and inventory write-offs.
marker 3 Net profit is the card’s profit, after everything above it.
Close the breakdown with the cross or the Esc key.
Products, Order items and Profit Flow
Section titled “Products, Order items and Profit Flow”The tables below the cards show the selected period.
The Products tab lists each product with its units, refunds, sales, ads, Amazon fees and profit. Under each product name you see its average selling price (ASP), average cost of goods (COGS) and stock at Amazon (FBA on-hand). Group the rows by SKU, ASIN, parent, marketplace, brand or supplier with Group by, and choose columns with Columns. Select a column heading to sort by it.
The Order items tab lists each order line with its status as Amazon reports it, sales, Amazon fees and profit.
The Profit Flow tab draws the period’s money as a flow, from sales on the left to profit on the right. The width of each band is its value, so the biggest costs stand out.
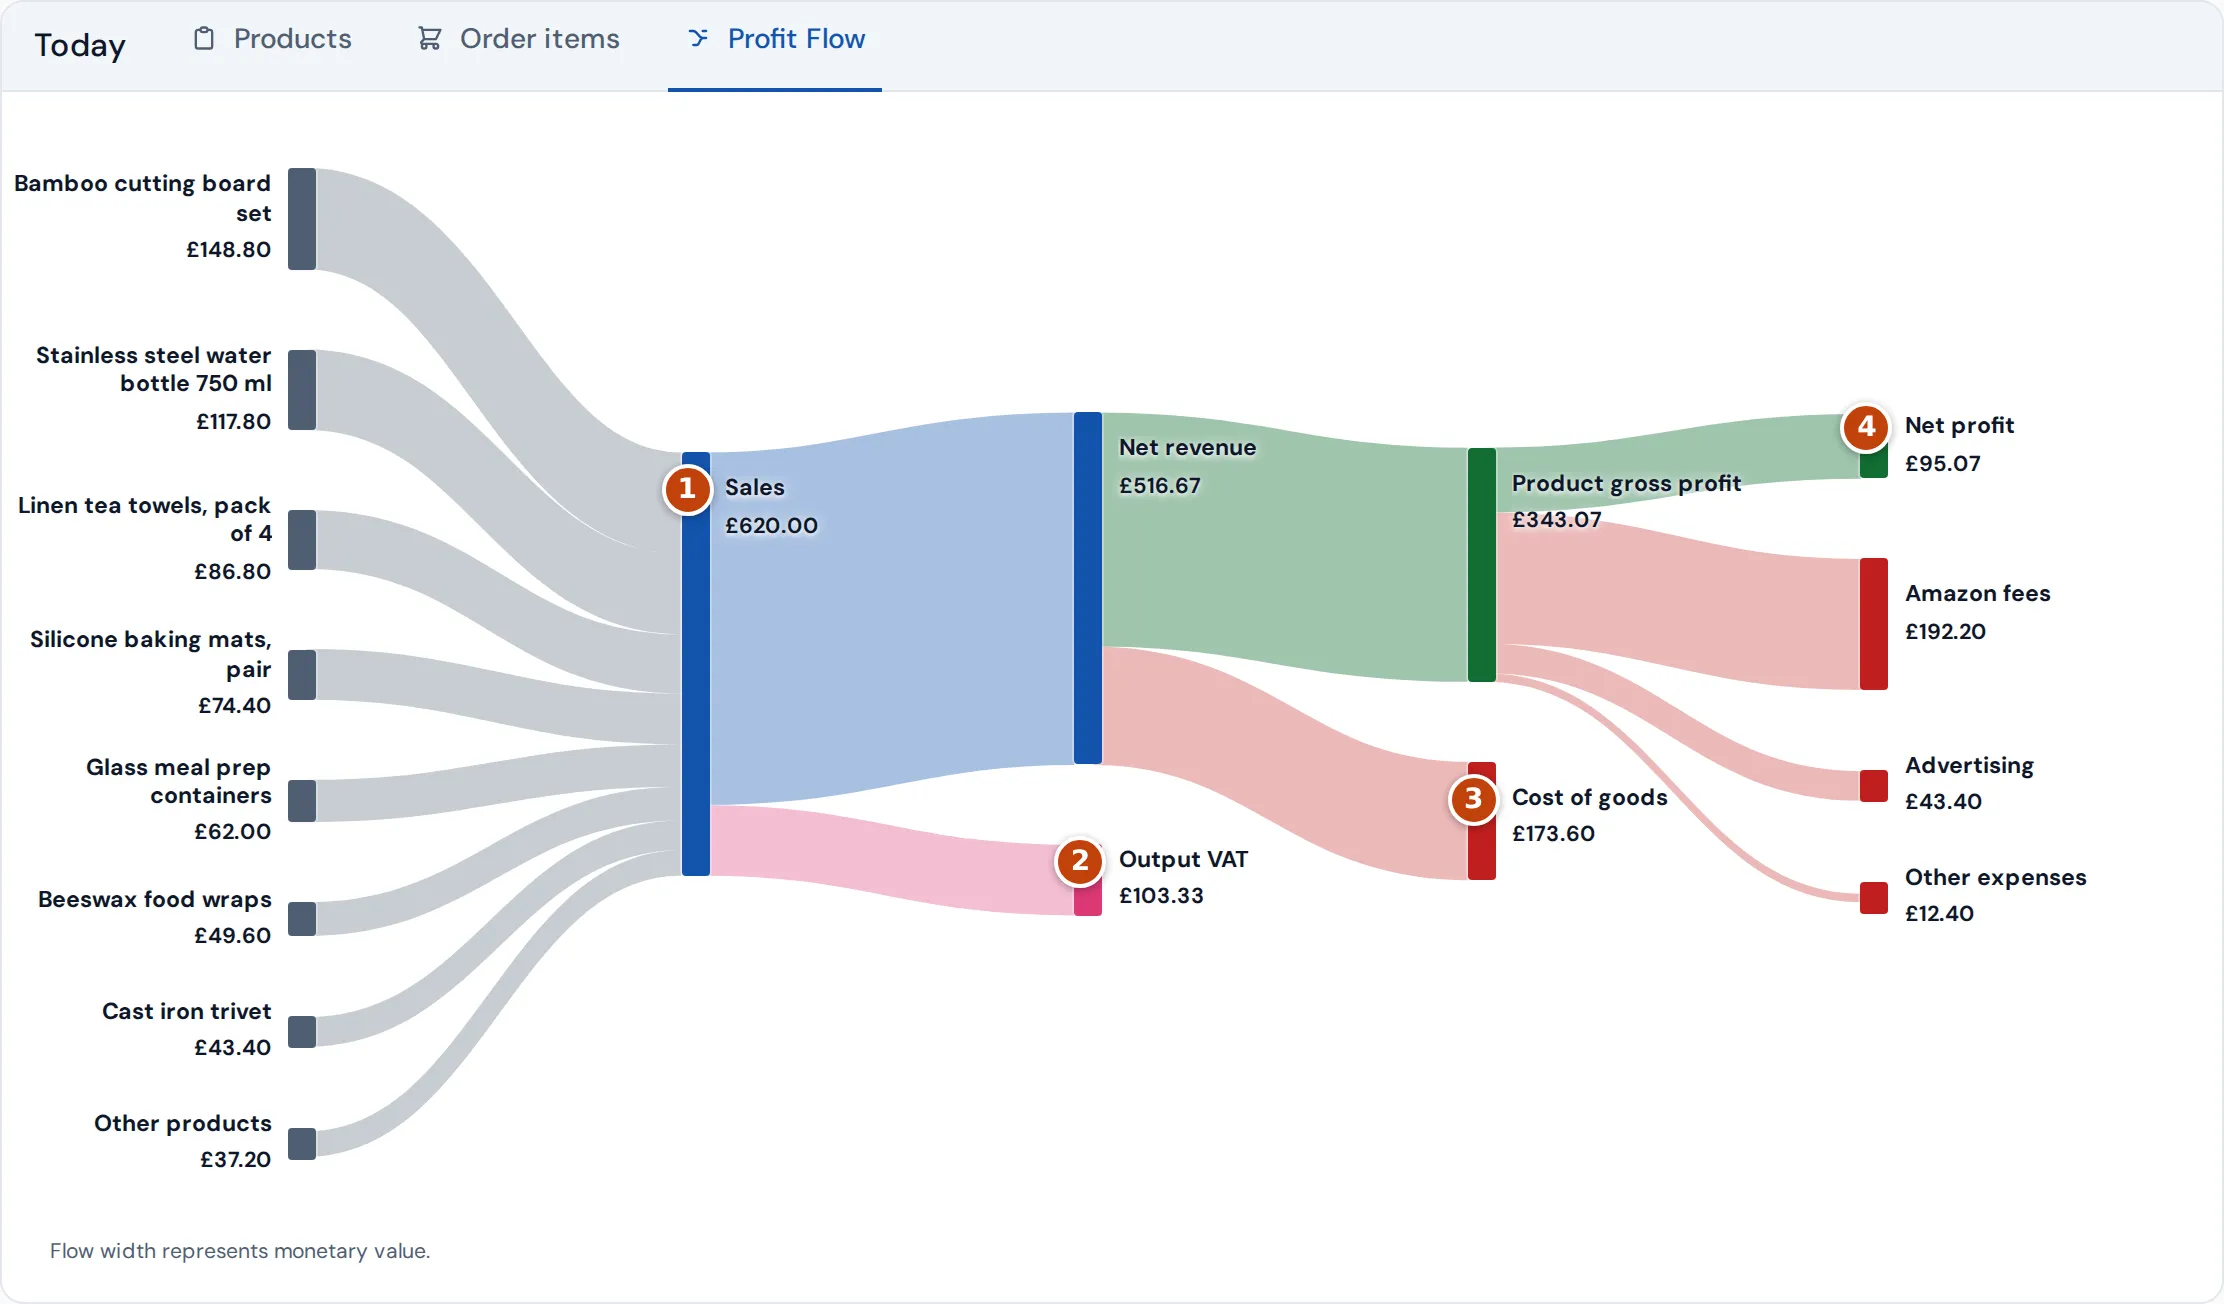
Read it from left to right: each product’s sales join into marker 1 sales. marker 2 Output VAT and refunds leave first, giving net revenue. marker 3 Cost of goods leaves next, giving gross profit. Amazon fees, advertising and other expenses leave last, and what remains is marker 4 profit.
To download the products or order items as a CSV file, select the download button at the right of the tabs. Profit Flow can’t be exported.
Filter by marketplace or product
Section titled “Filter by marketplace or product”Choose a marketplace from All marketplaces to see only that marketplace. Figures from every marketplace are converted into your reference currency, which you set in Settings.
Choose products from All products to see only those products. The cards then leave out expenses, subscriptions and storage that aren’t charged to a particular product, so profit there is product profit, not business profit.
Where the Dashboard’s figures come from
Section titled “Where the Dashboard’s figures come from”- Dates: Orders count on the day they were placed, in the marketplace’s own local time. The dates that Today and the other periods cover follow the Timezone in Settings. Refunds count on the day Amazon posted them. The P&L page counts sales when they ship instead, so its totals for a period can differ from the Dashboard’s.
- New orders: Sales, orders and units from new orders are added as Amazon reports them. Their fees, costs and profit follow once the figures update; until then, in the Products table, those figures have a dashed underline to show they’re from the last update.
- Saved figures: If the figures for the periods you chose aren’t ready, the Dashboard may show your last saved dashboard instead. Each card’s title then ends in “(saved)” and shows its original dates. You can’t change periods or open card details until the update finishes.
- Amazon fees: Fees Amazon has charged are used as soon as they’re posted. Until then Crateworth uses Amazon’s fee estimate for the product. When the charged fee arrives it replaces the estimate.
- Account fees: Storage and inbound fees that Amazon charges to your account rather than to an order, such as an inbound placement fee, count on the day Amazon posts them. One can make a short period, such as Today, look much worse than usual. When one is at least a tenth of the card’s sales, or half of its profit before those fees, the card names it, for example “Includes £207.71 inbound placement fee posted today”. The amount is without VAT, as in Storage + inbound.
- Cost of goods: Each unit sold uses the cost of the stock it came from, oldest stock first, from your purchase orders and product costs. Sellable returns add their cost back.
- VAT: If you’re registered for VAT in a country, the VAT on your sales there is taken off before net proceeds and profit. VAT that Amazon collects as a marketplace facilitator is taken off too, whether or not you’re registered; Output VAT in the breakdown shows it on its own line. VAT on Amazon fees that you can reclaim is added back.
- Stock: FBA on-hand under each product name is Amazon’s live available (sellable) quantity across your marketplaces. It’s today’s stock, whichever period you select. It shows in red when it covers fewer than 10 days of sales at the period’s rate.
Why a figure is estimated, blank or “Unresolved”
Section titled “Why a figure is estimated, blank or “Unresolved””Estimated figures
Section titled “Estimated figures”While an order is pending, Amazon doesn’t confirm its price. Order items shows the listing price marked Est. until Amazon confirms the sale price in its next daily orders report. Its profit is an estimate too, and its cost comes from a forecast that doesn’t use up stock.
Blank or “Unresolved” figures
Section titled “Blank or “Unresolved” figures”Crateworth leaves profit blank rather than guess when something it needs is missing. Cards show —, and Order items shows Unresolved. Hover over Unresolved to see which input is missing:
- Cost of goods is missing. Add the product’s cost on the Costs & COGS page.
- The pending inventory cost forecast isn’t ready, or a cost it needs is missing.
- No posted Amazon fee or current fee estimate is available yet.
- Sales VAT is unresolved. When a product has no VAT rate, the breakdown says how much of the period’s sales need one.
When products sold in the period have no cost, Profit Flow says so and links to Review COGS.
While your first import runs
Section titled “While your first import runs”Until your last 30 days are imported, the cards show Importing your first 30 days. This usually takes about 20 minutes after you connect Amazon. Older history fills in over the following day. See Connect Amazon and import your data.
If someone else sees different figures
Section titled “If someone else sees different figures”Team members whose access hides profit see sales, orders, refunds and advertising, but not profit, costs, fees or margin. Their downloads leave out the hidden figures too.
Demo mode, in the account menu, hides product names, ASINs, SKUs and images so you can share your screen. It changes only what’s shown.
Related pages
Section titled “Related pages”- Operations, under Workspace in the sidebar, gives an operational view: inventory position, cash and commitments, priority actions, FBA inbound, inventory health, listings and logistics.
- Sync Health, at the bottom of the sidebar, shows how up to date each kind of Amazon data is.
- Why figures differ from Seller Central