
Inventory overview
The Inventory overview lists every product with its stock at Amazon, in your own warehouses and on the way to you, with how fast it sells and how many days the stock will last. To open it, in the sidebar, under Inventory, select Overview. Select a product’s row to open its inventory details page.
What’s on the Inventory overview
Section titled “What’s on the Inventory overview”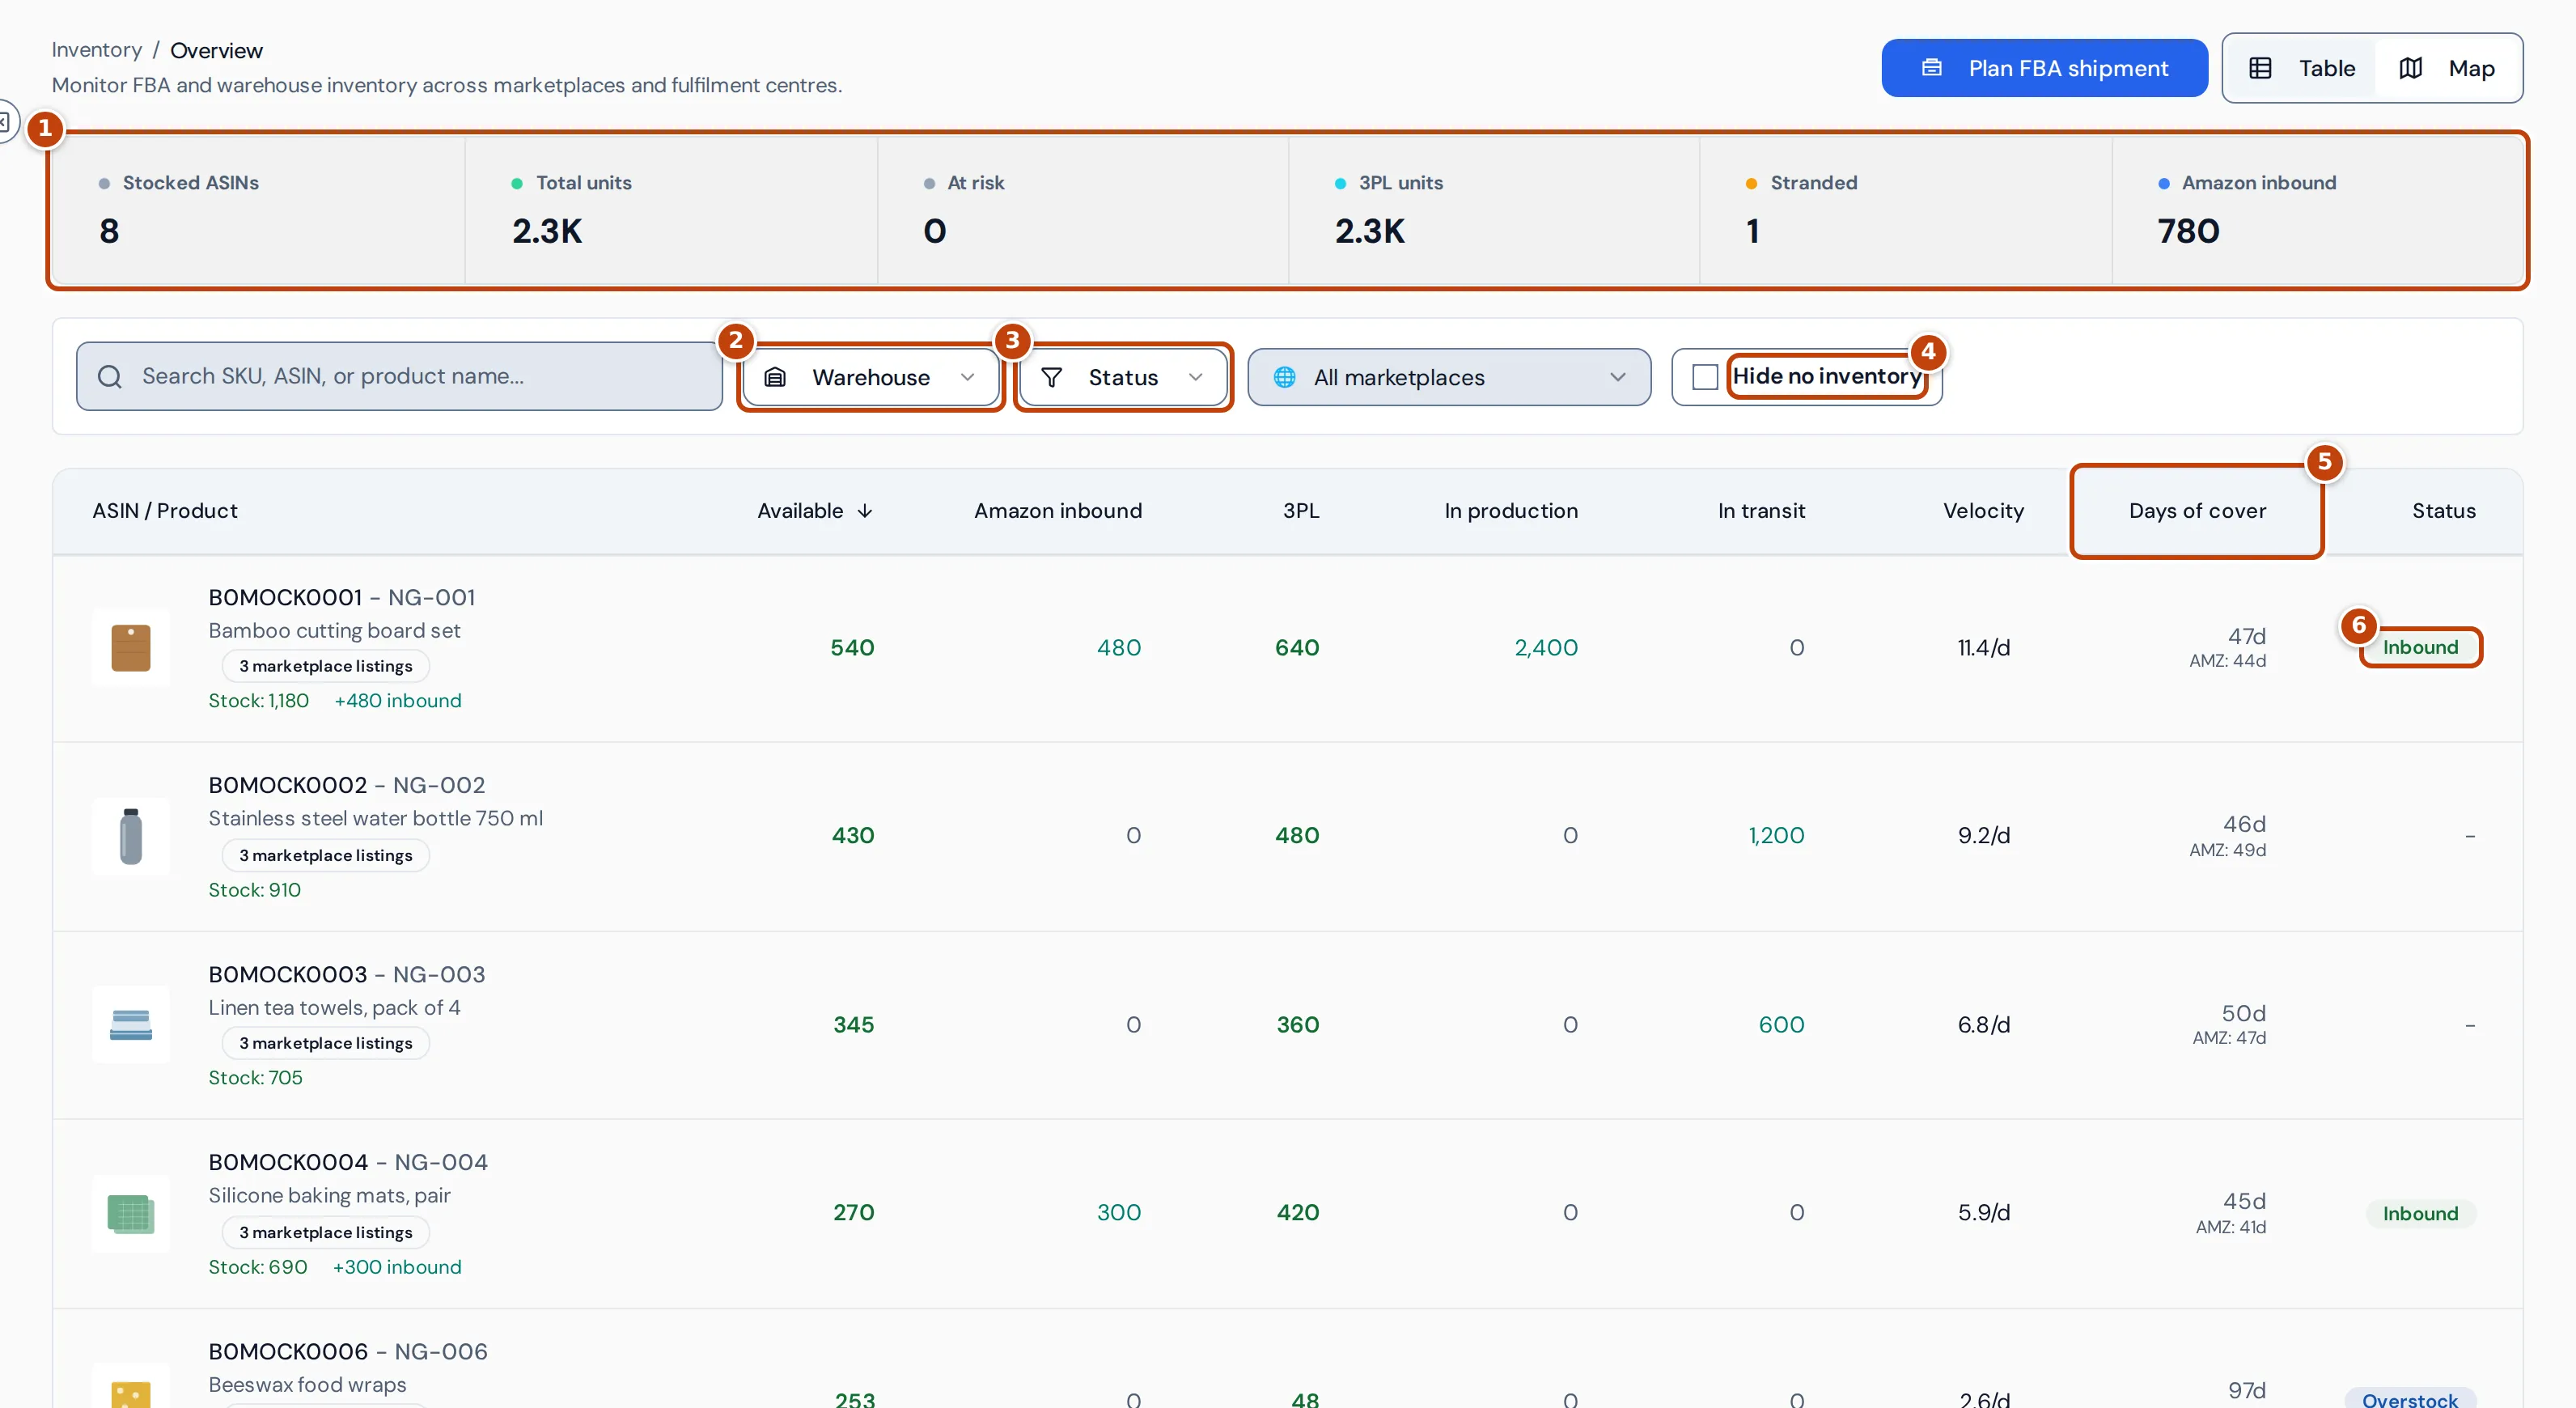
The summary figures along the top marker 1 are:
| Figure | What it is |
|---|---|
| Stocked ASINs | Products with stock available at Amazon or in your warehouses, or units in production or in transit to you. |
| Total units | Units available at Amazon. With All marketplaces, stock shared between marketplaces (such as one EU pool listed in Germany and France) is counted once. With one marketplace selected, your warehouse stock is added. |
| 3PL units | Units available in your own warehouses, from the Warehouse stock page. |
| Stranded | The number of products (not units) that Amazon reports as stranded. |
| Amazon inbound | Units on their way into Amazon’s fulfilment centres. |
The summary figures follow the marketplace you choose, but not the other filters. The filter bar has:
- Search by SKU, ASIN or product name.
- marker 2 Warehouse narrows the table to stock in chosen Amazon fulfilment centres.
- marker 3 Status shows only products with Stockout risk, Stranded, Overstock or Has inbound; with several ticked, a product matching any of them is shown. To find products running low, use Stockout risk.
- The marketplace menu chooses one marketplace or All marketplaces.
- marker 4 Hide no inventory leaves out products with no stock available.
Clear removes all the filters.
The columns in the table
Section titled “The columns in the table”Each row is a product. With All marketplaces selected, a product sold in several marketplaces is one row, marked with the number of marketplace listings. With one marketplace selected, each row is that marketplace’s listing.
| Column | What it shows |
|---|---|
| Available | Units Amazon can sell now. |
| Amazon inbound | Units in shipments on their way into Amazon. |
| 3PL | Units available in your own warehouses. |
| In production | Units still being made by your suppliers. |
| In transit | Units shipped from your supplier and not yet received. Shipments already linked to an Amazon inbound shipment count as Amazon inbound instead. |
| Velocity | Average units sold per day. |
| Days of cover marker 5 | How many days the stock lasts at the current velocity. |
| Status | A badge for the product’s main issue. |
Under each product name, the stock line shows its total available units and any inbound to Amazon. Select the ASIN to open the product on Amazon. Select a column heading to sort by it; drag headings to reorder or resize columns.
Days of cover
Section titled “Days of cover”Days of cover is the available stock divided by the velocity, rounded down. With All marketplaces selected it uses stock at Amazon only; with one marketplace selected it adds your warehouse stock. It shows 365+ beyond a year, red under 14 days and amber under 30 days. The AMZ figure underneath is Amazon’s own days of supply from its inventory planning report.
Status badges
Section titled “Status badges”The Status column marker 6 shows the first of these that applies:
- Low stock: under 14 days of cover. The Stockout risk filter finds the same products.
- Stranded: Amazon reports some of the stock as stranded.
- Overstock: more than 90 days of cover.
- Inbound: stock is on its way into Amazon.
A dash means none of these apply.
Change how velocity is worked out
Section titled “Change how velocity is worked out”Velocity is a weighted average of the units sold per day over the last 3, 7, 30, 60 and 180 days. By default the last 3 days count for 50%, the last 7 days for 30% and the last 30 days for 20%.
To change the weighting for one product:
- Select the product’s velocity figure in the Velocity column. Velocity settings opens, with the current velocity, days of cover and available stock.
- Change the percentage for each period. The weights must add up to 100%.
- Optional: tick Take seasonality coefficients into account for sales forecasting and set a coefficient for each month, or enter a Projected monthly growth rate.
- Select Save settings. The table updates with the new velocity.
Reset to defaults puts the standard weights back.
Look at stock on the map
Section titled “Look at stock on the map”Select Map at the top of the page to see where your stock is: each marker is an Amazon fulfilment centre or one of your warehouses, sized by the units there. Select a marker to see the products held there. FC transfers shows stock moving between Amazon fulfilment centres. To see an earlier day’s stock, choose a date in Select date; only days with a stock snapshot can be chosen.
To plan sending stock from your warehouse to Amazon, select Plan FBA shipment.
Where the overview’s figures come from
Section titled “Where the overview’s figures come from”- Stock at Amazon: Crateworth reads Amazon’s FBA inventory for your current stock, and Amazon’s daily Inventory Ledger report for stock per fulfilment centre and for stranded stock. When you filter by marketplace or fulfilment centre, the figures come from the latest Ledger snapshot, which can be a day behind.
- Warehouse stock: your own warehouse records on the Warehouse stock page.
- In production and in transit: your suppliers’ production batches and supply pipeline shipments.
- Velocity: units ordered, from your order history, excluding today.
- The AMZ days of supply: Amazon’s inventory planning report, read daily.
Product inventory details
Section titled “Product inventory details”Select a product’s row on the Inventory overview to open its inventory details page (headed Detail).
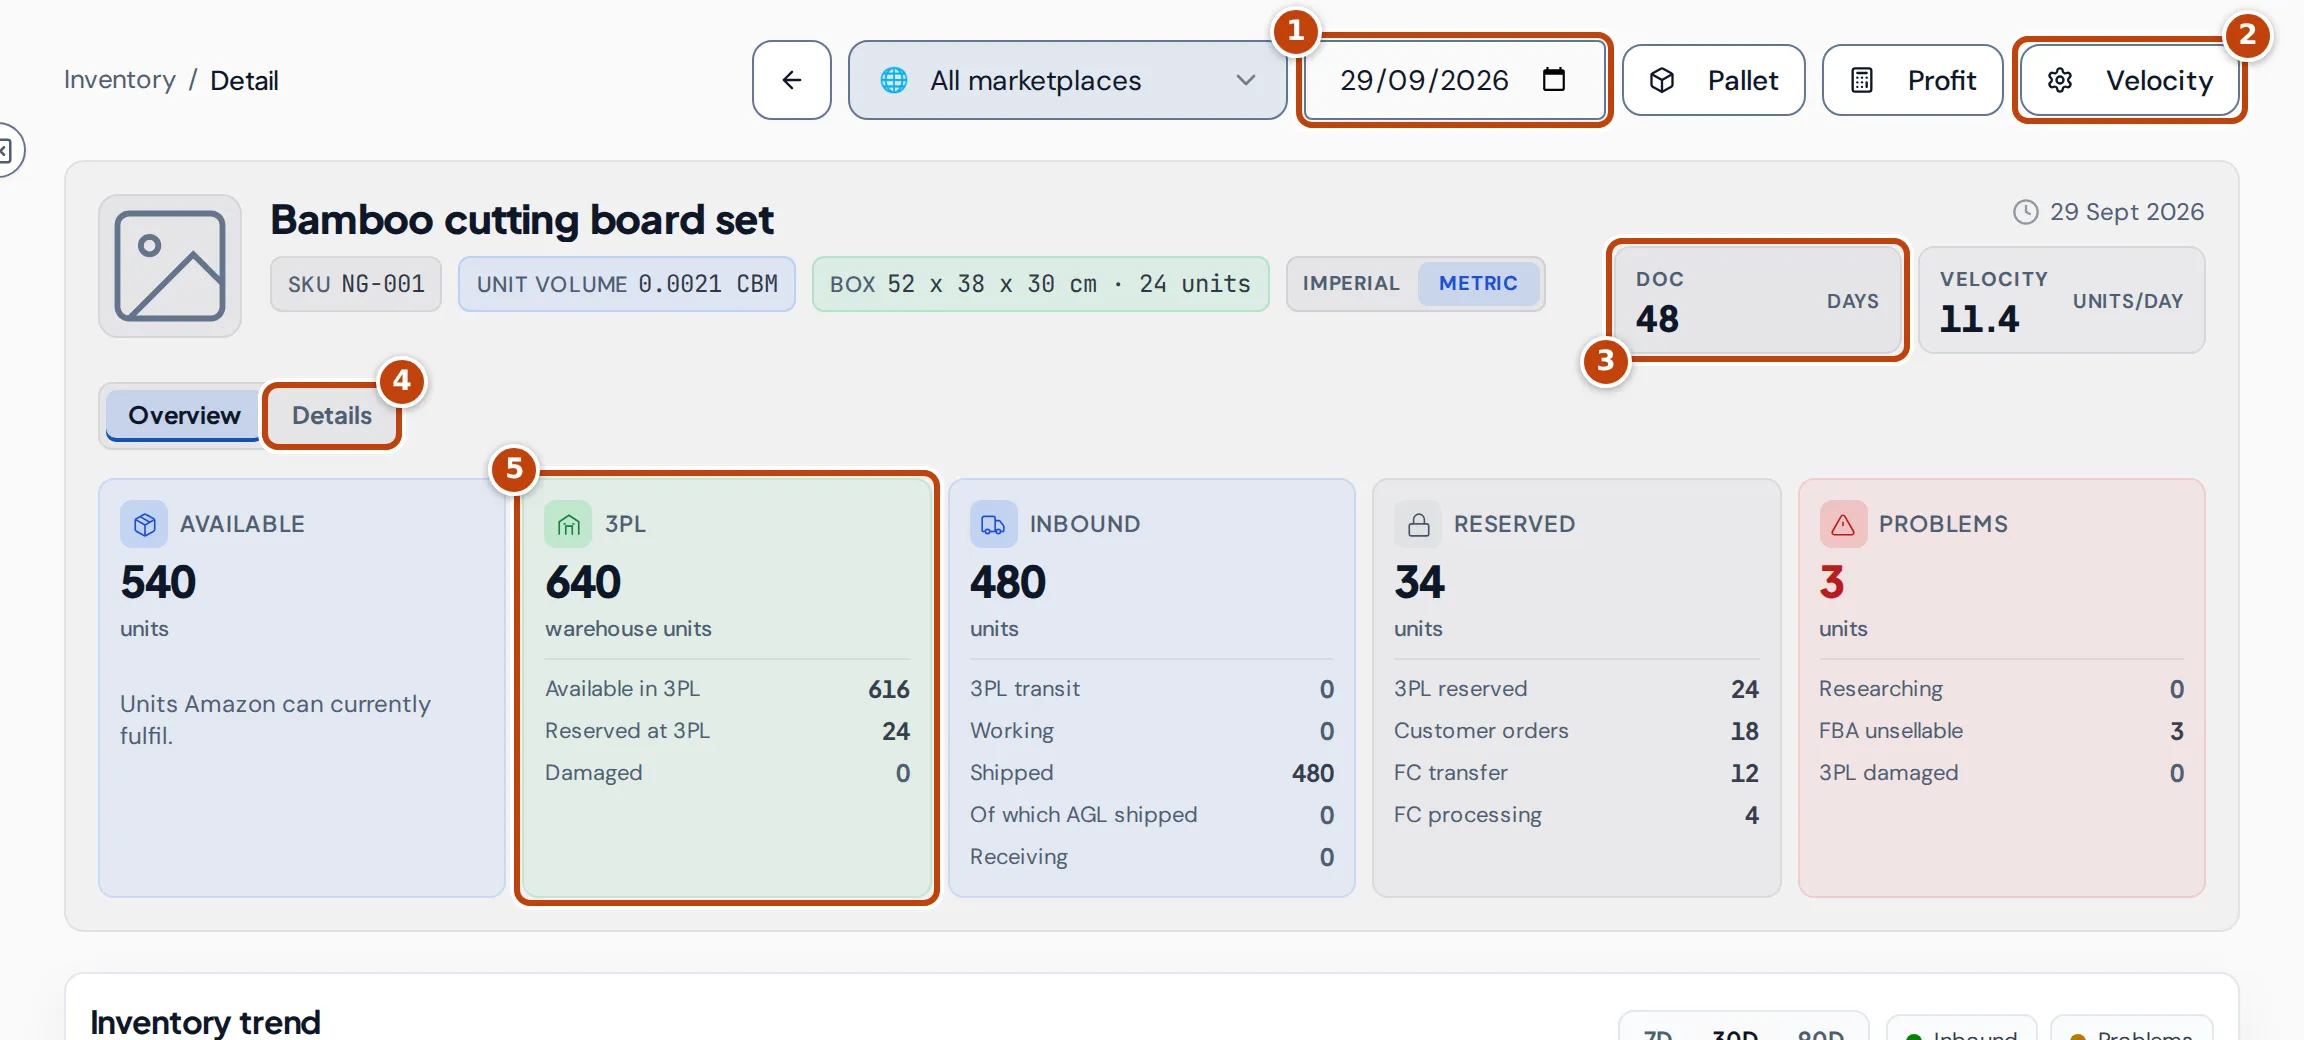
Along the top are the marketplace menu, the date box marker 1 and buttons for Pallet, Profit and Velocity marker 2. Velocity opens the same Velocity settings as the overview. Profit opens the Profit calculator, which works out the product’s profit per unit at a price you choose.
The product card shows the SKU, package size, unit volume and carton size. Imperial and Metric switch the units of measure (this needs edit access to Settings). On the right are DOC marker 3, the days of cover, and the velocity in units per day.
The Overview tab has five cards:
- Available: units Amazon can fulfil now.
- 3PL marker 5: units in your own warehouses, split into available, reserved and damaged.
- Inbound: units on the way into Amazon, split into Working, Shipped and Receiving, plus 3PL transit: units from your warehouse lots that are in transit.
- Reserved: units Amazon is holding, split into Customer orders, FC transfer and FC processing, plus any reserved at your warehouse.
- Problems: units Amazon is researching and FBA unsellable stock, plus damaged stock at your warehouse.
The Details tab marker 4 lists where the stock is: each Amazon fulfilment centre with its sellable, unsellable and stranded units, stock by country, your warehouse balances, and units in production and in transit.
DOC on the details page
Section titled “DOC on the details page”On the inventory details page, DOC is the units Amazon can fulfil plus units moving between fulfilment centres (still buyable, though delivery may take longer), divided by the daily velocity, rounded down. It leaves out customer-order reservations, units being processed, inbound and unsellable stock, and your warehouse stock.
Further down the details page
Section titled “Further down the details page”- Inventory trend: available, inbound and problem units day by day over 7, 30 or 90 days (View inventory trend values shows them as a table).
- Product storage utilisation: the product’s storage volume, once Amazon has reported it.
- Removal / reimbursement history: the latest Amazon removals and reimbursements.
- Sales coverage: the product’s cost layers. See Costs & COGS.
- Recent activity: large rises and falls in stock. Active alerts: alerts for the product.
See an earlier day
Section titled “See an earlier day”To see the product’s stock on an earlier day, choose the date in the date box. Amazon’s figures change to that day; warehouse and pipeline figures stay current and are labelled (current). DOC and velocity show a dash for a past date. Select Current inventory to go back to today. The date you choose also applies to the overview’s table.
Why a figure looks wrong or blank
Section titled “Why a figure looks wrong or blank”Total units changes when I choose a marketplace
Section titled “Total units changes when I choose a marketplace”On the Inventory overview, Total units with All marketplaces counts Amazon stock only, with shared stock counted once. With one marketplace selected, it adds your warehouse stock, so the totals differ.
Available shows “Ambiguous”
Section titled “Available shows “Ambiguous””With All marketplaces selected, the Inventory overview counts stock shared between marketplaces once. When Crateworth can’t yet tell which marketplaces share the same physical stock, it shows Ambiguous rather than a total that could double-count. Choose a single marketplace to see its figures.
The details page shows dashes with All marketplaces
Section titled “The details page shows dashes with All marketplaces”With All marketplaces selected, the details page adds up each physical stock pool once. It uses Amazon’s Inventory Ledger to tell which marketplace listings share the same stock. Until the Ledger has reported the product, the Available, Inbound, Reserved and Problems cards show a dash, with a note above them, rather than figures that could double-count.
When the product has stock in both the UK and the EU (for example with Remote Fulfilment), each marketplace’s Amazon figures include stock held in the other network, so Crateworth doesn’t add them up:
- Available adds the UK network’s and the EU network’s own available units from Amazon’s Manage FBA Inventory report, listed under the card.
- Inbound adds the units still to arrive on your open inbound shipments. For an earlier day it shows a dash.
- FBA unsellable under Problems comes from the Inventory Ledger. Researching, the Problems total and Reserved show a dash, because Amazon doesn’t split them by network.
Choose a single marketplace to see Amazon’s own figures for it.
Days of cover or Velocity shows a dash
Section titled “Days of cover or Velocity shows a dash”The product has no recent sales, so velocity is zero, or its stock total can’t be worked out. On the details page, DOC and velocity also show a dash when you choose a past date.
In production or In transit is 0 for one marketplace
Section titled “In production or In transit is 0 for one marketplace”With one marketplace selected, production and transit units appear on only one listing per product, so the product’s other listings show 0. Choose All marketplaces to see them for every product.
The table is empty
Section titled “The table is empty”If you chose a date on the map or the details page, the table shows that day’s snapshot. Select Return to latest snapshot to go back to the latest one. If filters are set, select Clear filters.
Related pages
Section titled “Related pages”- Warehouse stock: your own and 3PL warehouse stock.
- Costs & COGS: what your stock cost and how it’s valued.
- Inventory health: Amazon’s view of ageing and excess stock.
- FBA shipment planner: send stock from your warehouse to Amazon.