
Search term performance
The Search term performance page shows, week by week, how shoppers searching on Amazon see, click, add to basket and buy your products, search term by search term. It also estimates what each search term is worth to you. To open it, in the sidebar, under Amazon reports, select Search term performance.
What you need for Search term performance
Section titled “What you need for Search term performance”The page uses Amazon’s Search Query Performance report from Brand Analytics, which Amazon provides only to brand owners with Brand Registry. Your Amazon connection also needs access to Brand Analytics. When Crateworth has no Brand Analytics search data that matches your filters, the page shows No search term performance data.
Amazon doesn’t provide the report in every marketplace. Poland, Belgium and Ireland, for example, have no Search Query Performance data.
Amazon publishes the report once a week, so the page has one column per report week.
What’s on the page
Section titled “What’s on the page”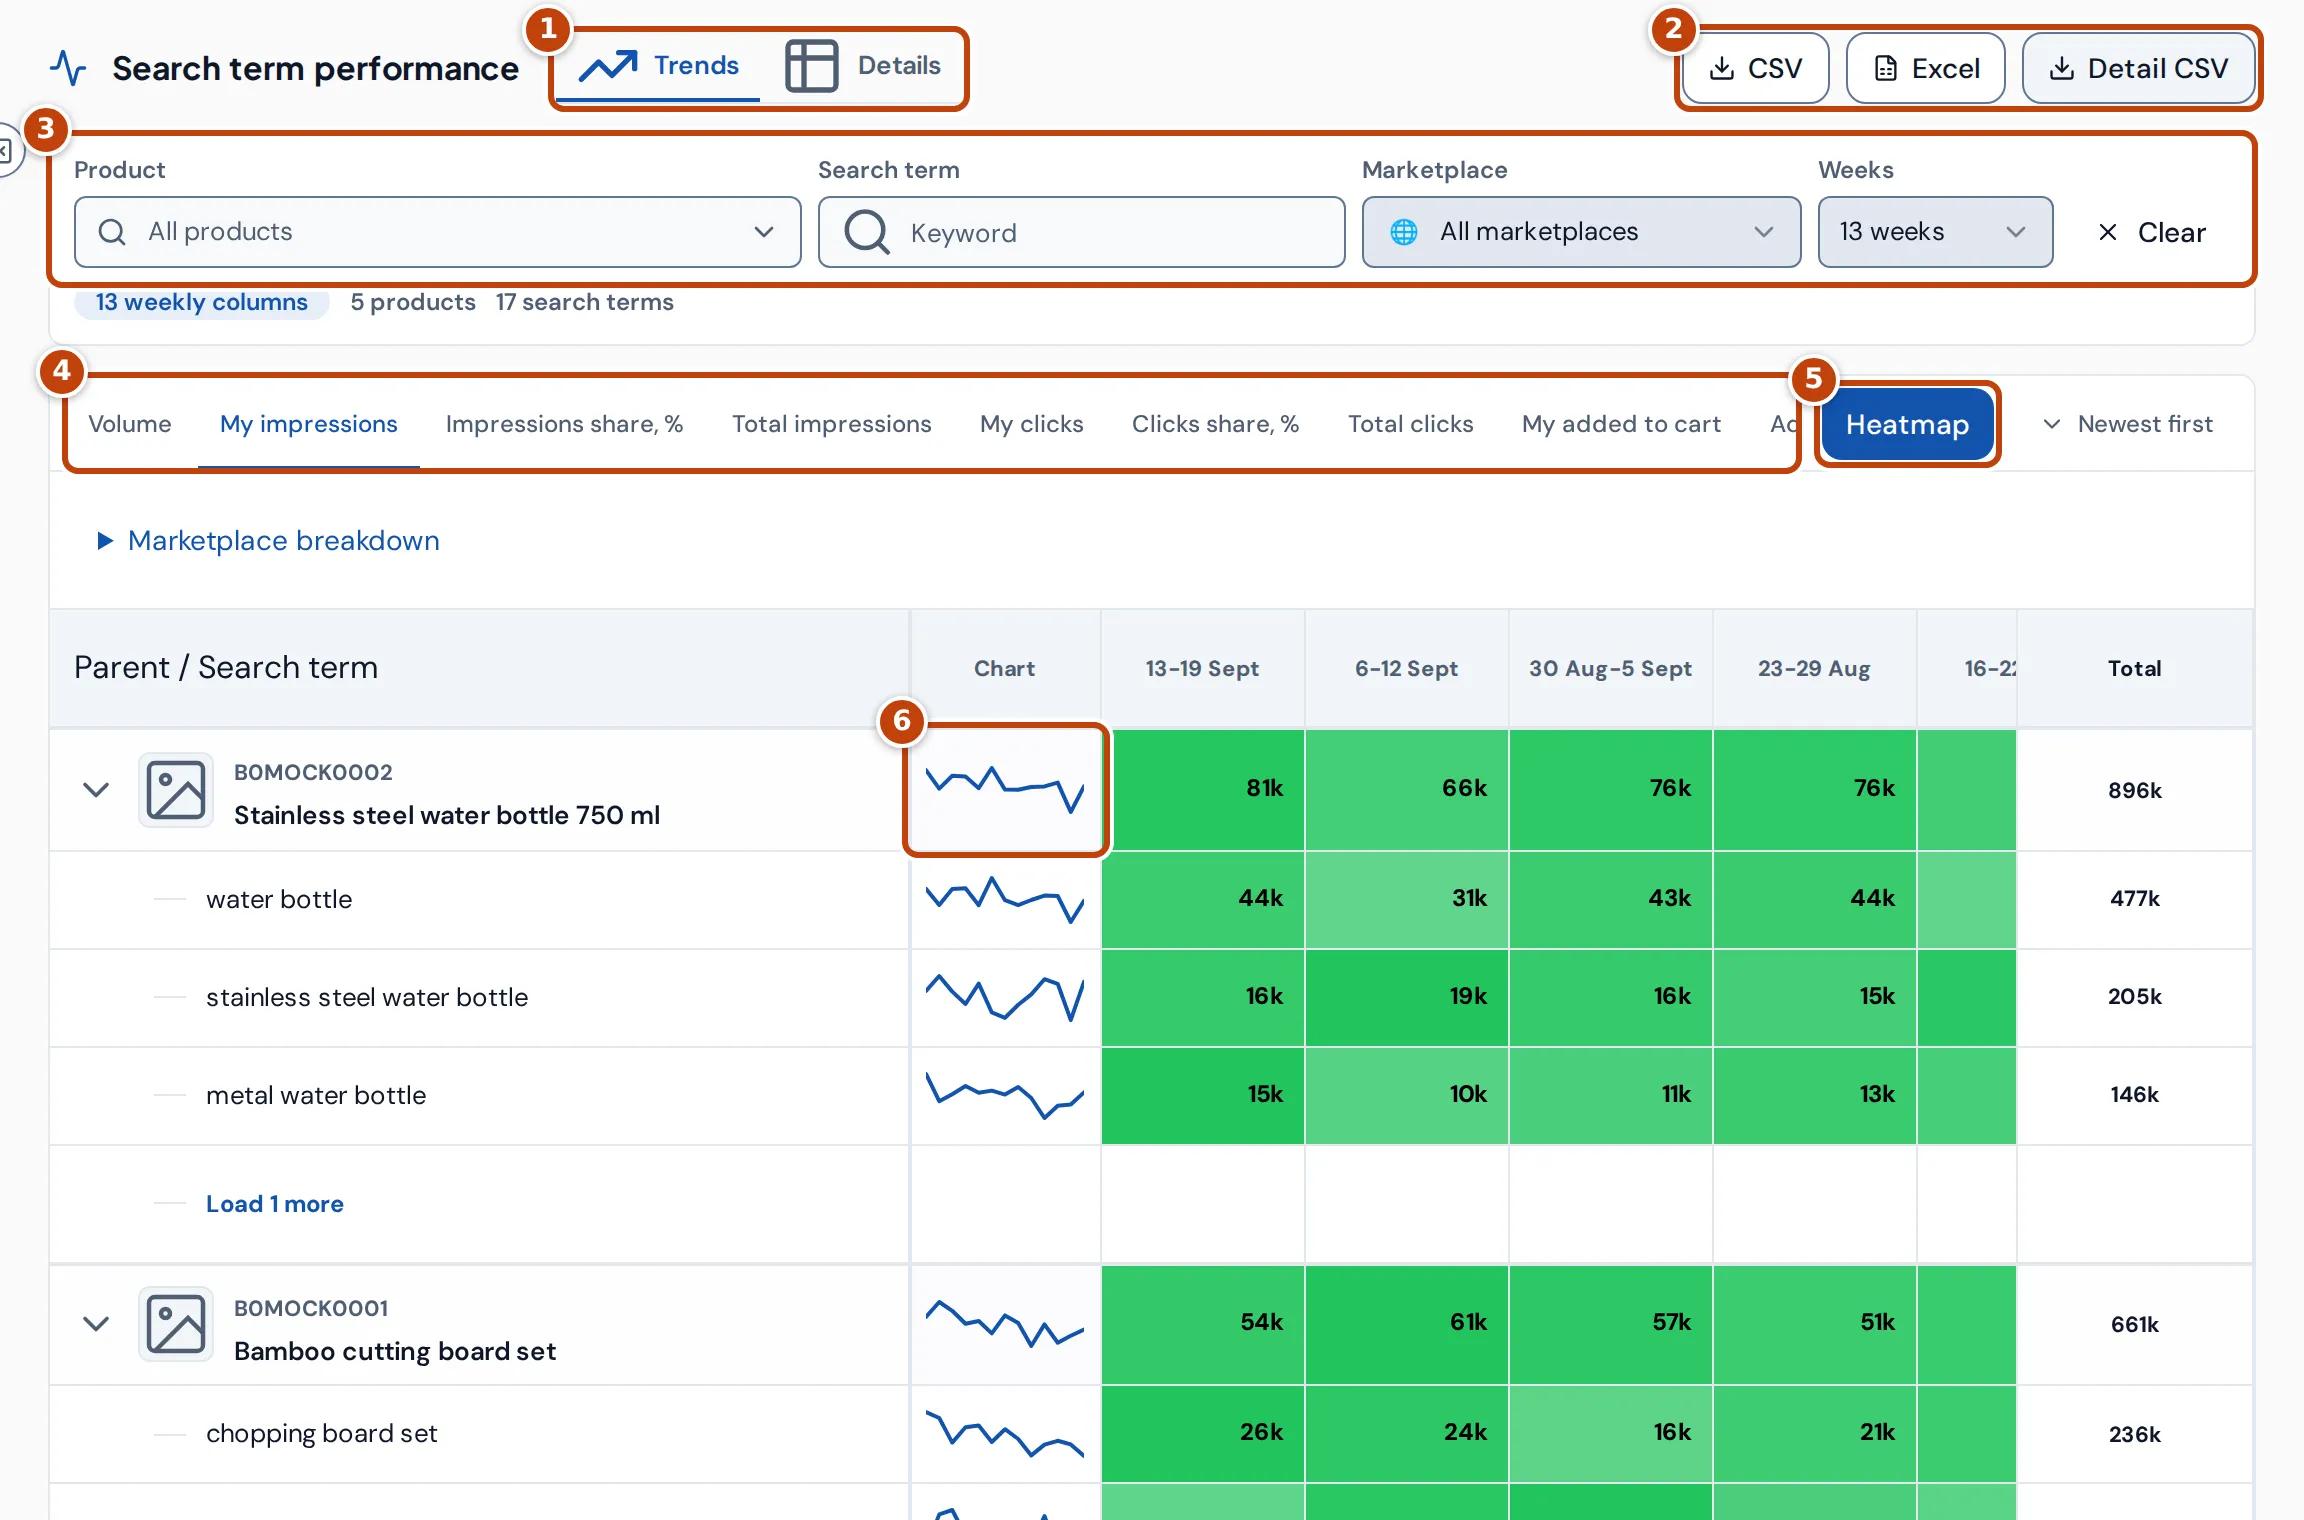
- marker 1 Trends shows a column per week. Details shows one week with every metric side by side.
- marker 2 CSV and Excel download the weekly table as you see it filtered. Detail CSV downloads Amazon’s rows per ASIN and week, including fields the page doesn’t show.
- marker 3 The filters: Product, Search term (a word or phrase to look for), Marketplace and Weeks (4, 8, 13, 26 or 52 weeks; 13 by default). Clear resets them.
- marker 4 The metric the weekly columns show. Select one to switch, for example from My impressions to My purchases.
- marker 5 Heatmap turns the cell colours on or off. The colours compare each week with the other weeks in the same row.
- marker 6 Select a product’s or search term’s small chart to open a larger chart of the selected metric.
Under the filters, the page shows how many weeks, products and search terms the table has. Newest first switches the week columns between newest first and oldest first.
Trends view
Section titled “Trends view”Each product has a row with its ASIN and title, and the search terms that led shoppers to it underneath. The first three search terms show; select Load 1 more (or however many there are) to see the rest. Select the arrow next to a product to collapse or expand it. Total at the right gives the figure for all the weeks shown, and the Total row at the bottom gives it for every product. Counts are added up; shares and rates are worked out from the added-up counts.
Hover over a cell to see its value, or why it’s empty.
The metrics you can choose:
| Metric | What it is |
|---|---|
| Volume | How many times shoppers searched for the term. |
| My impressions, My clicks, My added to cart, My purchases | How often your product was shown, clicked, added to basket and bought from that search. |
| Total impressions, Total clicks | The same for all products in the search results. |
| Impressions share, %, Clicks share, %, Added to cart share, %, Purchases share, % | Your share of all impressions, clicks, basket adds and purchases for the search. |
| Purchase rate | Your purchases divided by your clicks. |
| Estimated net sales, Estimated contribution, Identifiable SP spend, Contribution after identifiable PPC | Crateworth’s estimates of what the search term is worth. See Estimated sales and contribution. |
| Impression-to-click share change, Click-to-cart share change, Cart-to-purchase share change | How your share changes from one step of the funnel to the next. A negative value means you lose share at that step. |
| Break-even ACOS | The advertising cost of sale at which the product would break even. |
| Organic rank, Organic rank movement | Your organic position for the search, from Keywords. |
| Opportunity score | A score out of 100 combining the search’s volume, how much purchase share you could still gain and the product’s contribution margin, scaled by how confident the estimate is. |
Details view
Section titled “Details view”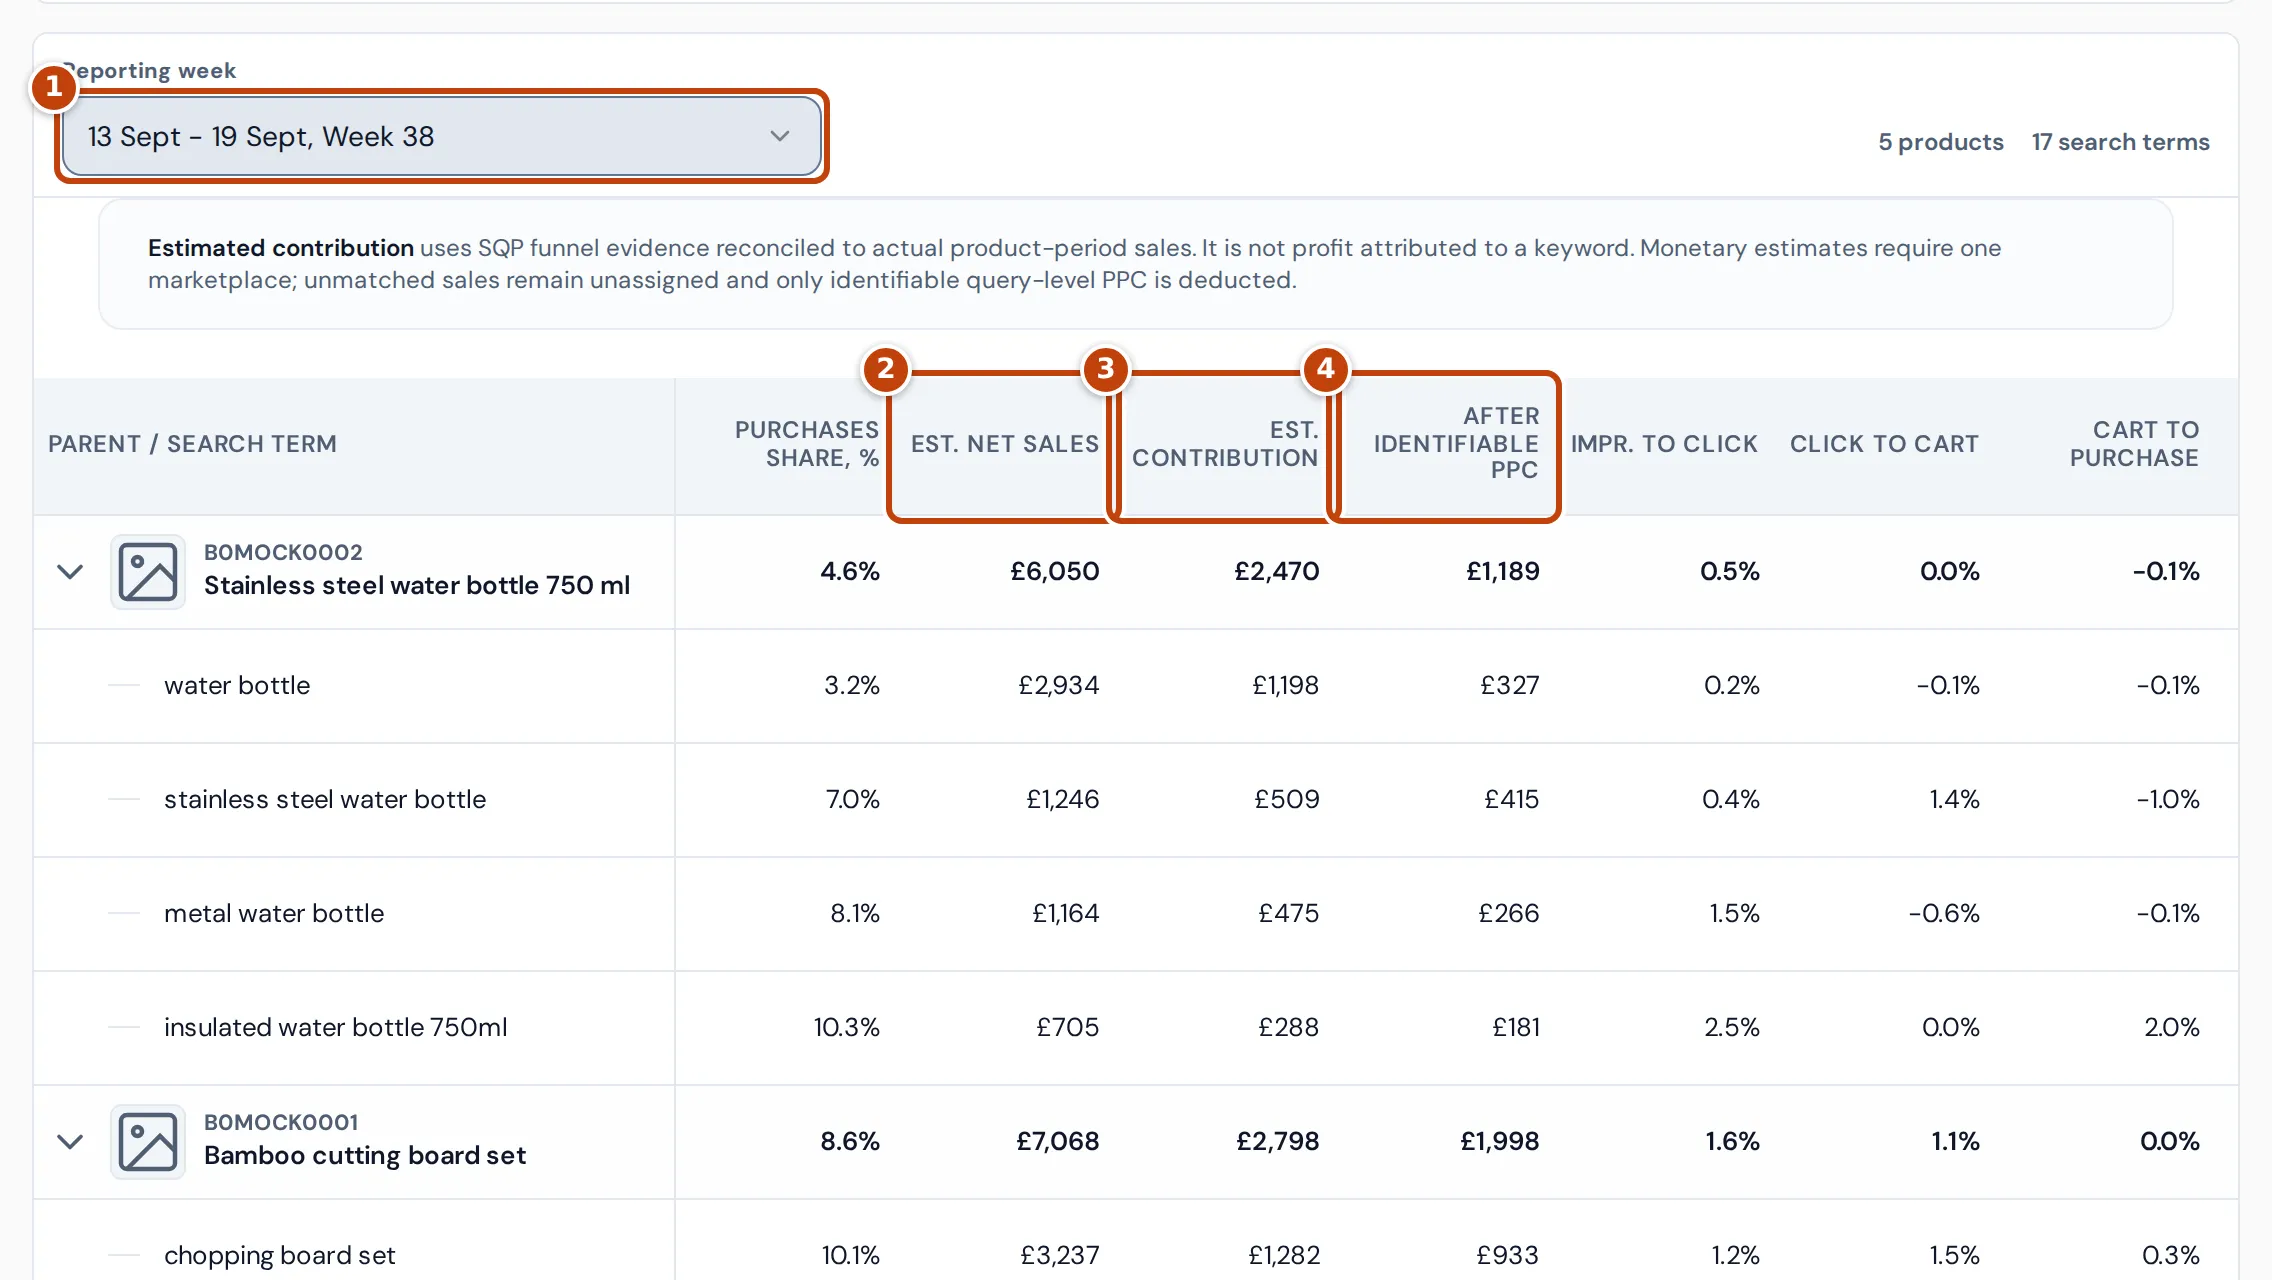
The Details view shows one week, chosen in marker 1 Reporting week, with every metric as a column, for each product and its search terms. Products are listed with the most impressions first. The table also has:
- My impressions share trend: whether your impressions share rose or fell compared with the week before. Hover over the arrow for the change.
- marker 2 Est. net sales, marker 3 Est. contribution and marker 4 After identifiable PPC: the estimates for that week. Hover over a value to see its confidence or why it’s missing.
- Opportunity and Confidence: the opportunity score and how much to trust the estimates (high, medium or low).
Scroll the table sideways to see every column. The search-term column stays in place.
Estimated sales and contribution
Section titled “Estimated sales and contribution”Amazon’s report says how many times your product was bought from each search, but not what you earned. Crateworth estimates it from your own figures for the product, marketplace and week, the same figures as your P&L:
- Estimated net sales: Amazon’s median purchase price for the product in that search, times your purchases from the search. When the estimates for all the product’s search terms add up to more than the product’s actual gross sales that week, they’re scaled down to fit. They’re then reduced in the same proportion as the product’s net sales are to its gross sales.
- Estimated contribution: the product’s contribution before advertising for the week, shared out in proportion to each search term’s estimated net sales. Contribution before advertising is the product’s gross profit for the week less Amazon fees (including VAT on them), shipping costs and other direct costs such as inventory write-offs, with the VAT on Amazon fees added back when you can reclaim it. Advertising isn’t deducted.
- Identifiable SP spend: Sponsored Products spend that can be matched to this exact search term and product.
- Contribution after identifiable PPC: estimated contribution less identifiable SP spend.
- Break-even ACOS: the product’s contribution before advertising divided by its gross sales for the week.
These are estimates, not profit earned from a keyword. Sales that can’t be matched to a search term stay unassigned, and only advertising spend that can be matched to the search term is taken off.
With All marketplaces selected, amounts from each marketplace are converted into your reference currency at the exchange rate for the end of the report week. Open Marketplace breakdown above the table to see each marketplace’s values in its own currency.
Why a value is blank, “-” or “Partial”
Section titled “Why a value is blank, “-” or “Partial””Hover over the cell to see the reason. The common ones:
- Amazon did not report this metric for the week: the search term had no data from Amazon that week, or Amazon left the value out.
- Amazon did not provide an ASIN median purchase price: estimates need Amazon’s purchase price for the product.
- Product accounting is being refreshed: your product figures for the week are being recalculated. The page tries again by itself every 15 seconds.
- No exact active tracked-keyword ranking exists for this week: organic rank shows only for search terms you track, and haven’t paused, on the Keywords page for the same product and marketplace, spelt the same, with a ranking that week. With All marketplaces selected, organic rank shows only for a search term reported in a single marketplace.
- No active Amazon Ads profile exists for this marketplace: identifiable SP spend needs Amazon Ads connected for that marketplace.
- The full week of Sponsored Products search-term and product reports is not available yet: SP spend appears once Amazon Ads has reported the whole week.
- No suitable exchange rate is available for the report week: an amount can’t be converted into your reference currency.
Partial next to a value means only some of the marketplaces in the row had that value. The total leaves the others out; Marketplace breakdown shows which.
Related pages
Section titled “Related pages”- Keywords tracks your organic rank for chosen search terms and suggests new ones from the same Brand Analytics data.
- Customer value shows how often buyers come back.