
Customer value
The Customer value page shows how much your Amazon buyers spend with you over several months, and how many of them come back to buy again. Use it to see which products bring repeat buyers and how that changes over time. To open it, in the sidebar, under Amazon reports, select Customer value.
What’s on the Customer value page
Section titled “What’s on the Customer value page”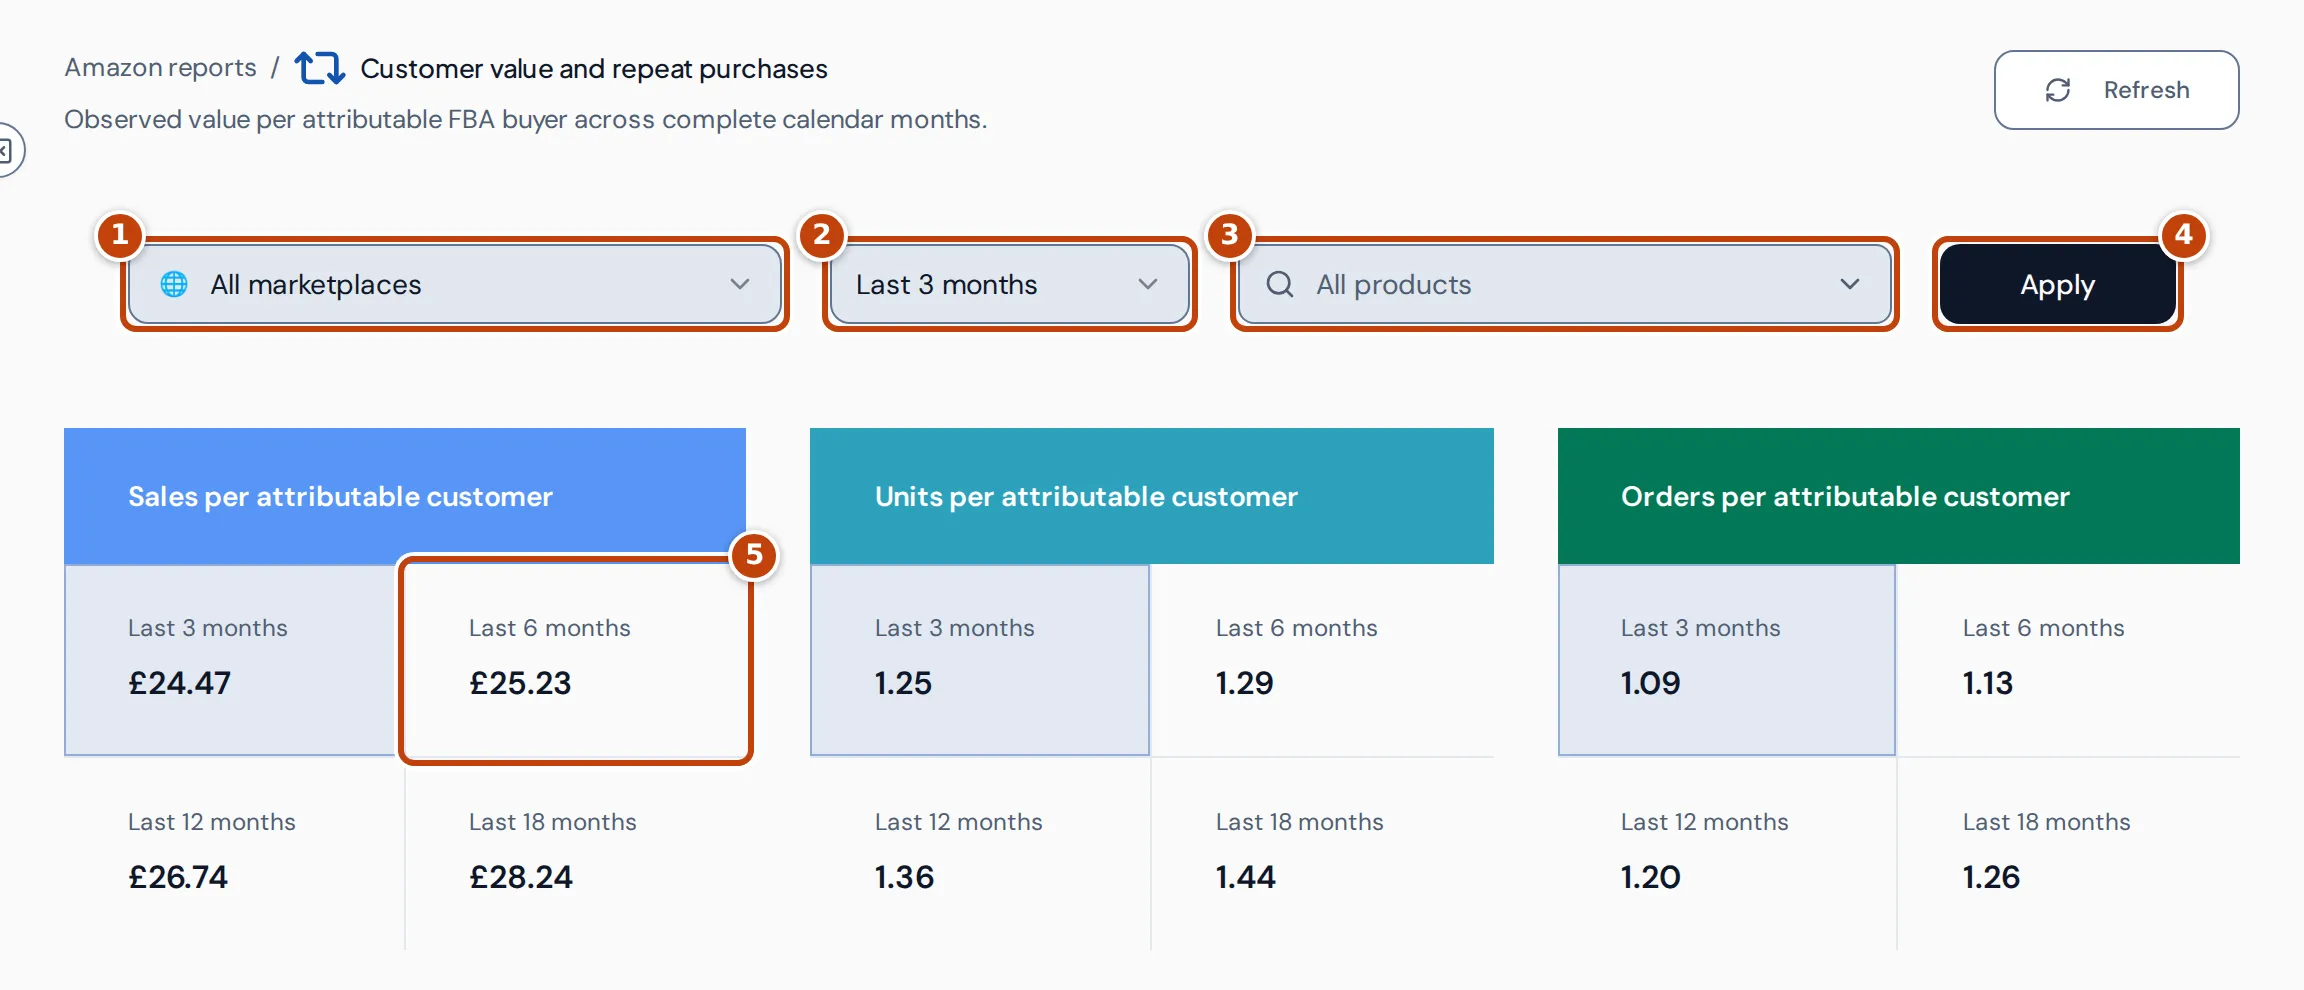
The filters along the top:
- marker 1 The marketplace filter chooses one marketplace, or All marketplaces.
- marker 2 The window filter chooses the period the table and the highlighted panel values use: Last 3 months, Last 6 months, Last 12 months or Last 18 months.
- marker 3 All products picks a product to look up in the product table.
- marker 4 Apply runs the product lookup.
Below the filters are three panels: Sales per attributable customer, Units per attributable customer and Orders per attributable customer. Each shows the figure for the last 3, 6, 12 and 18 months. marker 5 Select a value to make that window the selected one; it’s the same as choosing it in the window filter.
Under the panels, the Repeat-purchase trend chart and the Product customer value table. Refresh, at the top right, reloads the figures.
What “attributable customer” means
Section titled “What “attributable customer” means”An attributable customer is a buyer Crateworth can recognise across orders, using the buyer details in Amazon’s report of FBA shipments. Each buyer is counted by a coded identifier rather than their name or email address, separately in each marketplace, so the same person buying in two marketplaces counts as two customers.
Only some orders count:
- Orders fulfilled by Amazon (FBA) and fully shipped. Pending, cancelled, partly shipped and seller-fulfilled orders are left out.
- Replacement orders are left out.
- Amazon Vine orders are left out. A Vine item in an order with other items adds no sales or units.
- Orders whose buyer can’t be recognised, or that match more than one buyer, are left out of the figures.
The figures are actual purchases only, with no forecast of future spending. Refunds aren’t deducted: a refunded order still counts at its full sales.
The panel figures
Section titled “The panel figures”Each panel value covers whole calendar months, ending with the last complete month. The current month is never included. Months are counted by purchase date in UTC.
| Figure | What it is |
|---|---|
| Sales per attributable customer | Sales from attributable orders divided by the number of attributable customers. |
| Units per attributable customer | Units in those orders divided by the number of customers. |
| Orders per attributable customer | Attributable orders divided by the number of customers. |
Sales on the Customer value page are the item prices Amazon reports on the orders, including VAT where the price includes it, before promotional discounts and without shipping or gift wrap.
Sales in a currency other than your reference currency are converted at the exchange rate for the day of purchase.
Hover over a value to see which marketplaces it includes.
Repeat-purchase trend
Section titled “Repeat-purchase trend”The Repeat-purchase trend chart shows each of the last 18 complete months on its own:
- Repeat customer rate: the share of the month’s customers who placed at least two orders in that month (left axis).
- Sales / attributable customer: the month’s sales divided by its customers (right axis).
Each point is labelled with the last day of its month. A gap in a line means no marketplace had complete enough data for that month. See Why a figure shows “Insufficient history”.
Product customer value table
Section titled “Product customer value table”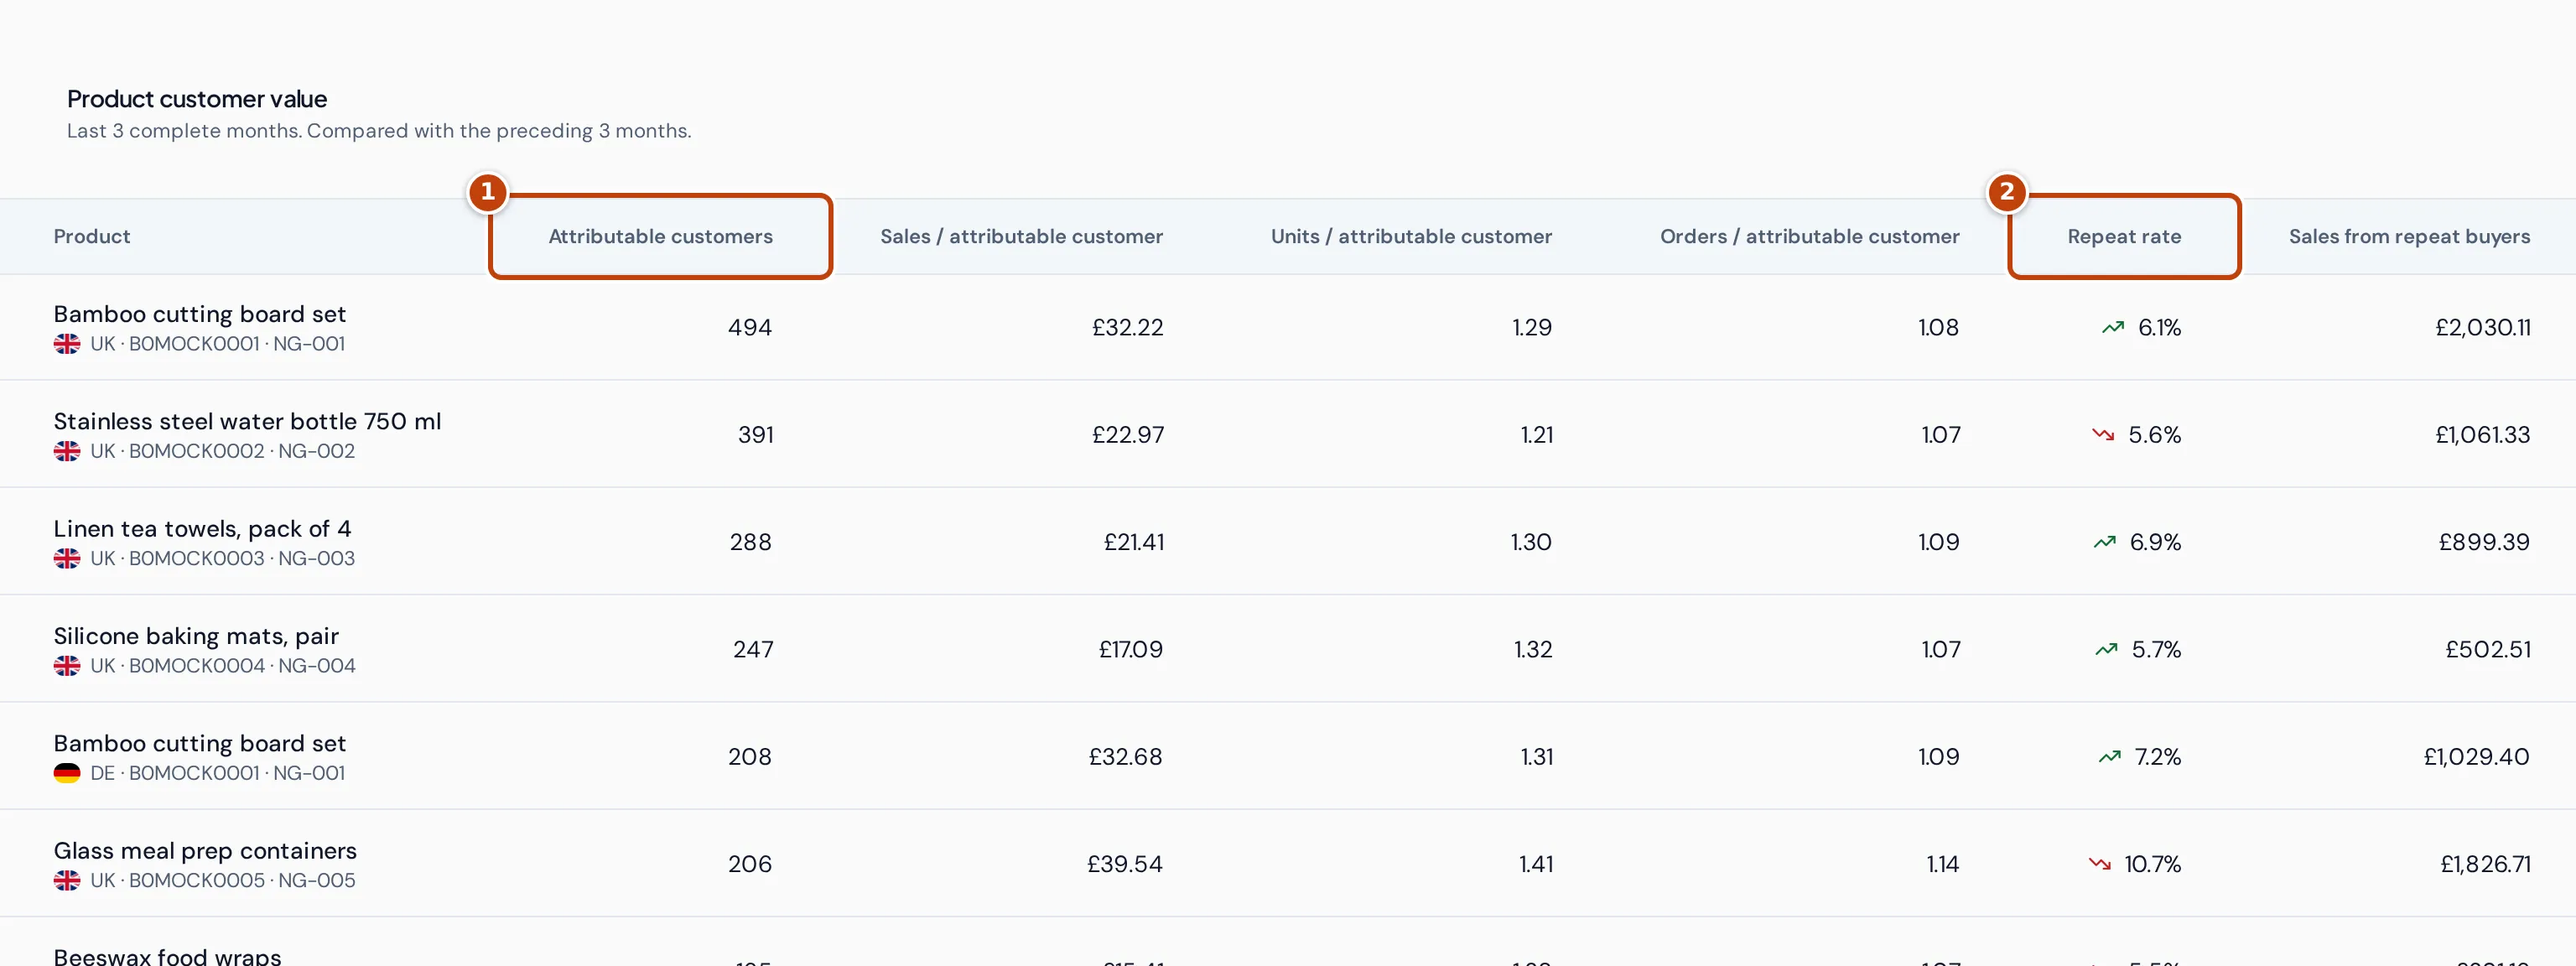
The Product customer value table lists each product for the selected window, grouped by marketplace:
- marker 1 Attributable customers: buyers who bought the product in the window.
- Sales / attributable customer, Units / attributable customer and Orders / attributable customer: the same ratios as the panels, for that product.
- marker 2 Repeat rate: the share of the product’s customers who placed at least two orders containing it in the window. A green up arrow or red down arrow shows whether it rose or fell compared with the window before. There’s no arrow when the rate didn’t change or the product had no attributable customers in the window before.
- Sales from repeat buyers: all sales of the product to buyers who ordered it at least twice in the window.
- Repeat-buyer sales share: sales from repeat buyers as a share of the product’s sales. Scroll the table sideways to see it on a narrower screen.
Each row shows its marketplace (a flag and short code such as UK or DE; hover for the country name) before the ASIN and SKU. With All marketplaces selected, a product sold in more than one marketplace has a row for each marketplace. Choose a marketplace in the filter to see one at a time.
When the selected window shows Insufficient history, the table is empty.
The table shows 500 products per page. Use Previous and Next below it to move between pages.
Look up one product
Section titled “Look up one product”- On the Customer value page, select All products and choose the product.
- Select Apply. The table shows only that product.
The product filter changes the table only. The panels and the chart still show all your products in the marketplaces you’ve chosen. The product stays selected when you change the marketplace or window; to see every product again, clear the product selection and select Apply.
Compare with the previous period
Section titled “Compare with the previous period”Under the table’s title, the page says what it compares with. Compared with the preceding 3 months (or 6, 12, 18) means the repeat rate arrows compare the selected window with the same number of months just before it.
When the page says Comparison requires the same included marketplaces with complete history and attribution in both periods, the arrows are hidden. Both windows need the same marketplaces, complete order history and every eligible order matched to a buyer before Crateworth compares them.
A comparison needs twice the window’s length of history: 24 months for Last 12 months and 36 months for Last 18 months. Crateworth usually holds 18 months of buyer history, so the arrows usually appear only for Last 3 months and Last 6 months.
Why a figure shows “Insufficient history” or is blank
Section titled “Why a figure shows “Insufficient history” or is blank”A window shows Insufficient history when no marketplace has complete data for the whole window. Each window includes only the marketplaces where:
- Customer value is set up for the marketplace,
- your Amazon order history covers every day of the window,
- Amazon’s FBA shipment report, which holds the buyer details, covers every day of the window,
- every order in that report is also in your Crateworth order history with its product details, and
- there’s at least one attributable order in the window.
A marketplace you connected recently, or one where Amazon’s buyer data starts later, drops out of longer windows until its history is long enough. A marketplace that drops out of one window can still count in a shorter one.
If the page says “Buyer analytics is not enabled”
Section titled “If the page says “Buyer analytics is not enabled””Crateworth sets up Customer value for each marketplace separately. When none of the marketplaces in the marketplace filter is set up, the page shows Buyer analytics is not enabled instead of the panels and table. If you’ve chosen a single marketplace, choose All marketplaces to check whether another marketplace has figures.
Related pages
Section titled “Related pages”- Search term performance shows how shoppers find and buy your products in Amazon search.
- Subscribe & Save shows your active subscriptions.
- Dashboard shows sales, costs and profit for recent periods.