Supplier quality
Supplier quality shows how often the units from each purchase order are refunded, so you can spot a bad batch or a supplier whose quality is slipping. Crateworth knows which purchase order each unit you sold came from, because it costs your sales from your stock, oldest first. It then counts the refunds against those sales. To open the page, in the sidebar, under Supply chain, select Supplier quality.
What’s on the Supplier quality page
Section titled “What’s on the Supplier quality page”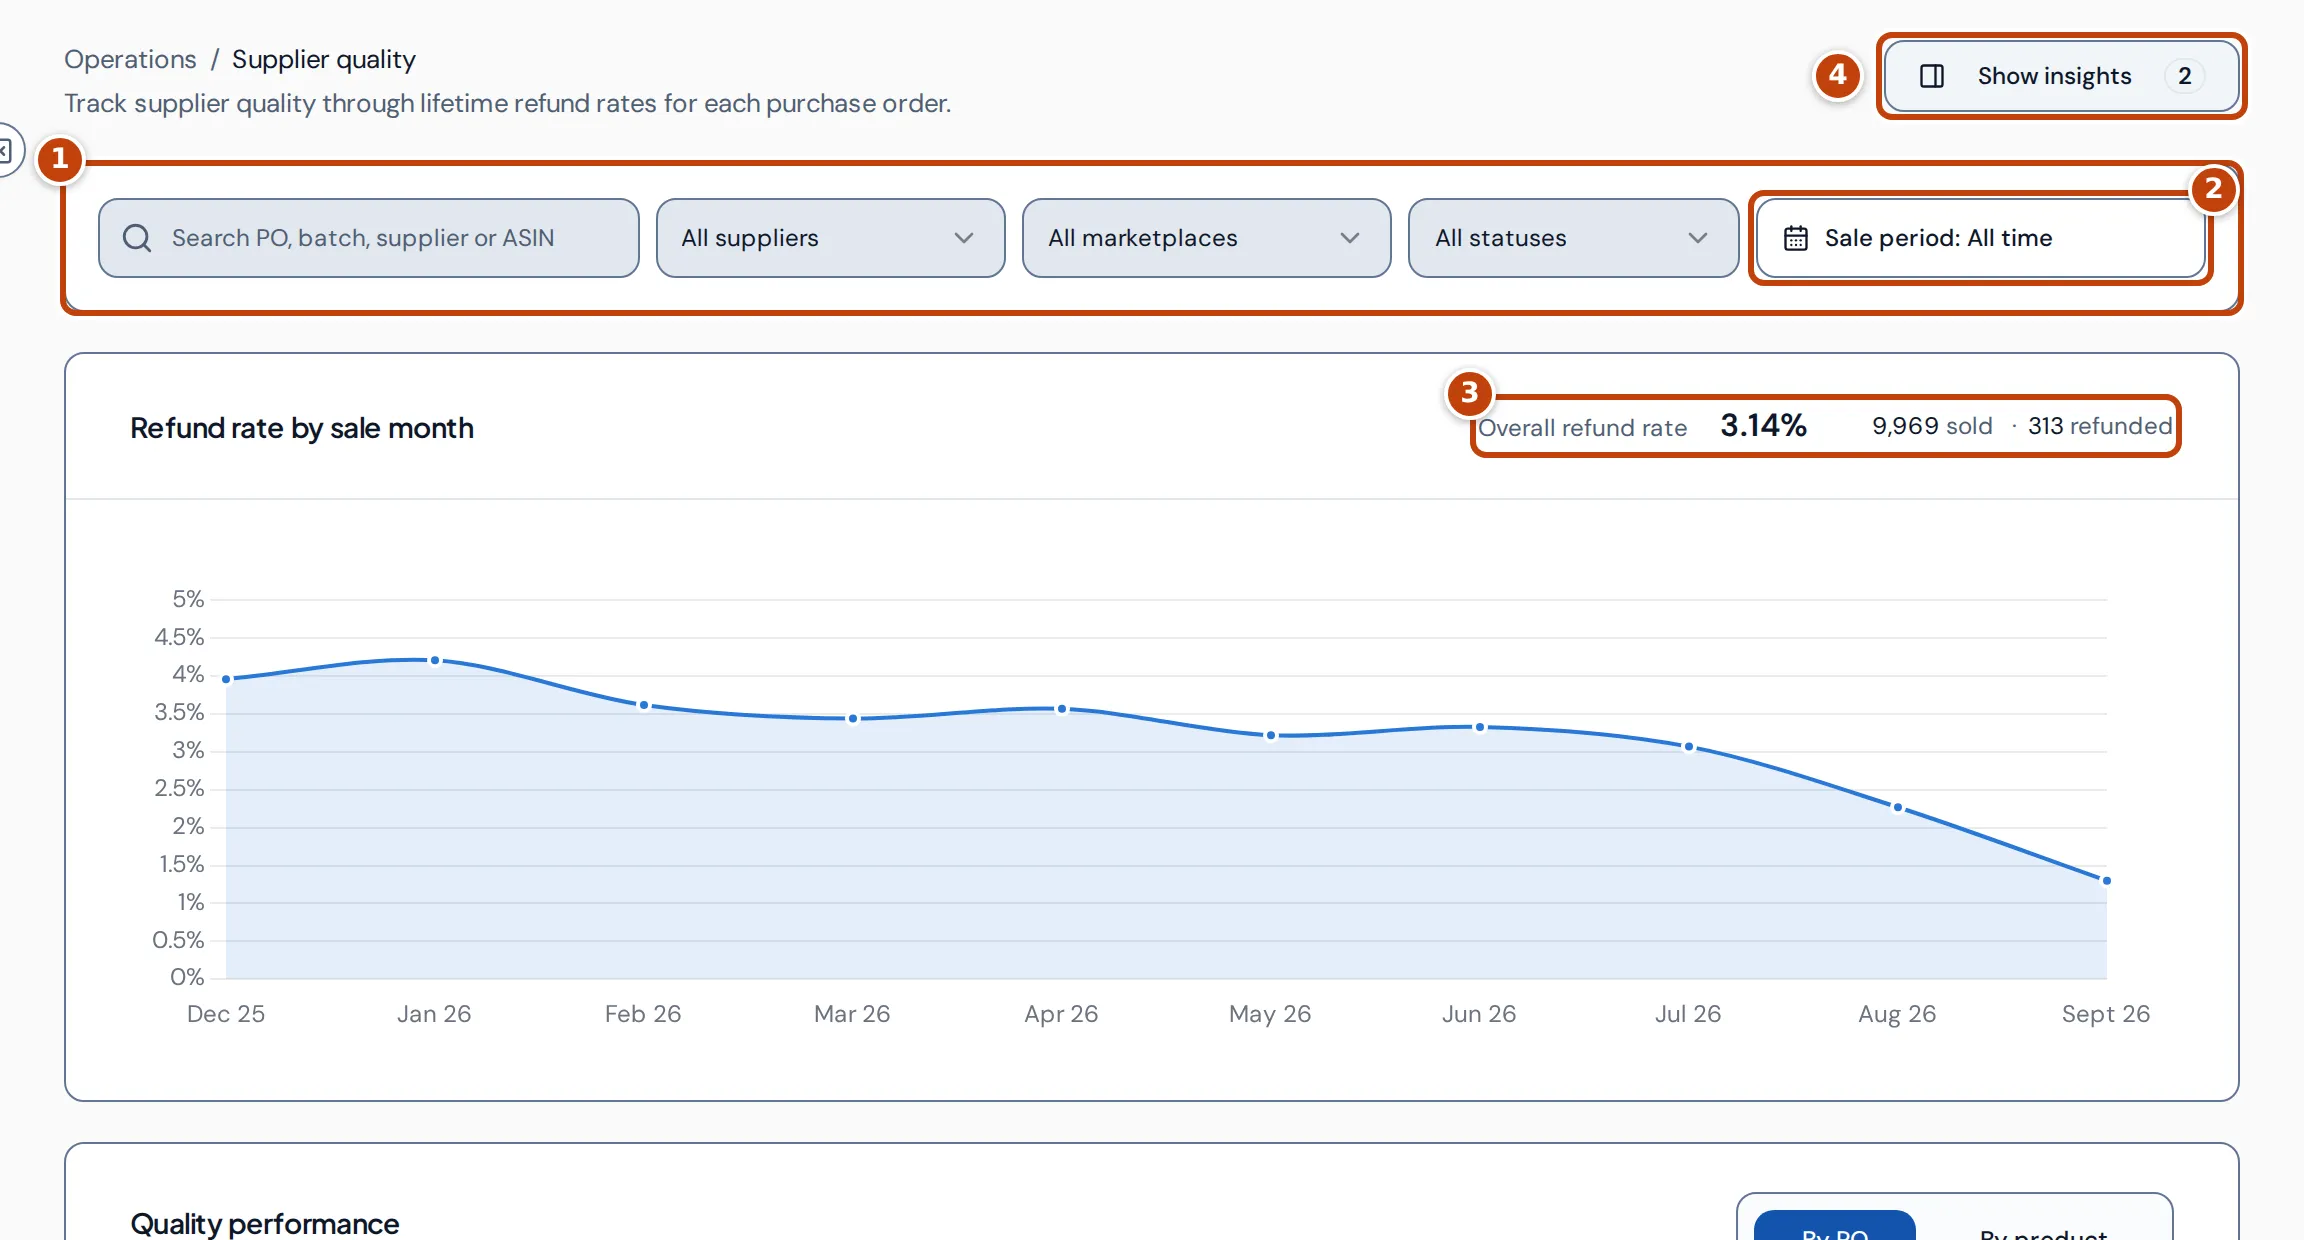
- marker 1 The filters: search by PO number, production batch, supplier, ASIN or product name, and filter by supplier, marketplace or quality status.
- marker 2 Sale period limits the figures to sales made in those dates: All time, Last 3 months, Last 6 months, Last 12 months or dates you choose. Refunds of those sales still count, even if they came later.
- marker 3 Overall refund rate is the refunded units divided by the sold units, for all the sales Crateworth could trace to a purchase order or production batch.
- marker 4 Show insights opens a side panel with quality alerts and each supplier’s share of sales.
The chart, Refund rate by sale month, shows the refund rate of each month’s sales.
How the refund rate is worked out
Section titled “How the refund rate is worked out”For each purchase order, Crateworth counts:
- Sold: units from non-cancelled orders whose cost came from this purchase order’s stock. When one order line drew on stock from two purchase orders, its units are shared between them.
- Refunded: units Amazon refunded on those order lines, shared the same way.
- Refund rate: refunded divided by sold, over the whole life of the stock.
Refunds stay with the month of the original sale. So a recent month’s rate starts low and can rise as later refunds come in. Older months are more settled.
Quality performance table
Section titled “Quality performance table”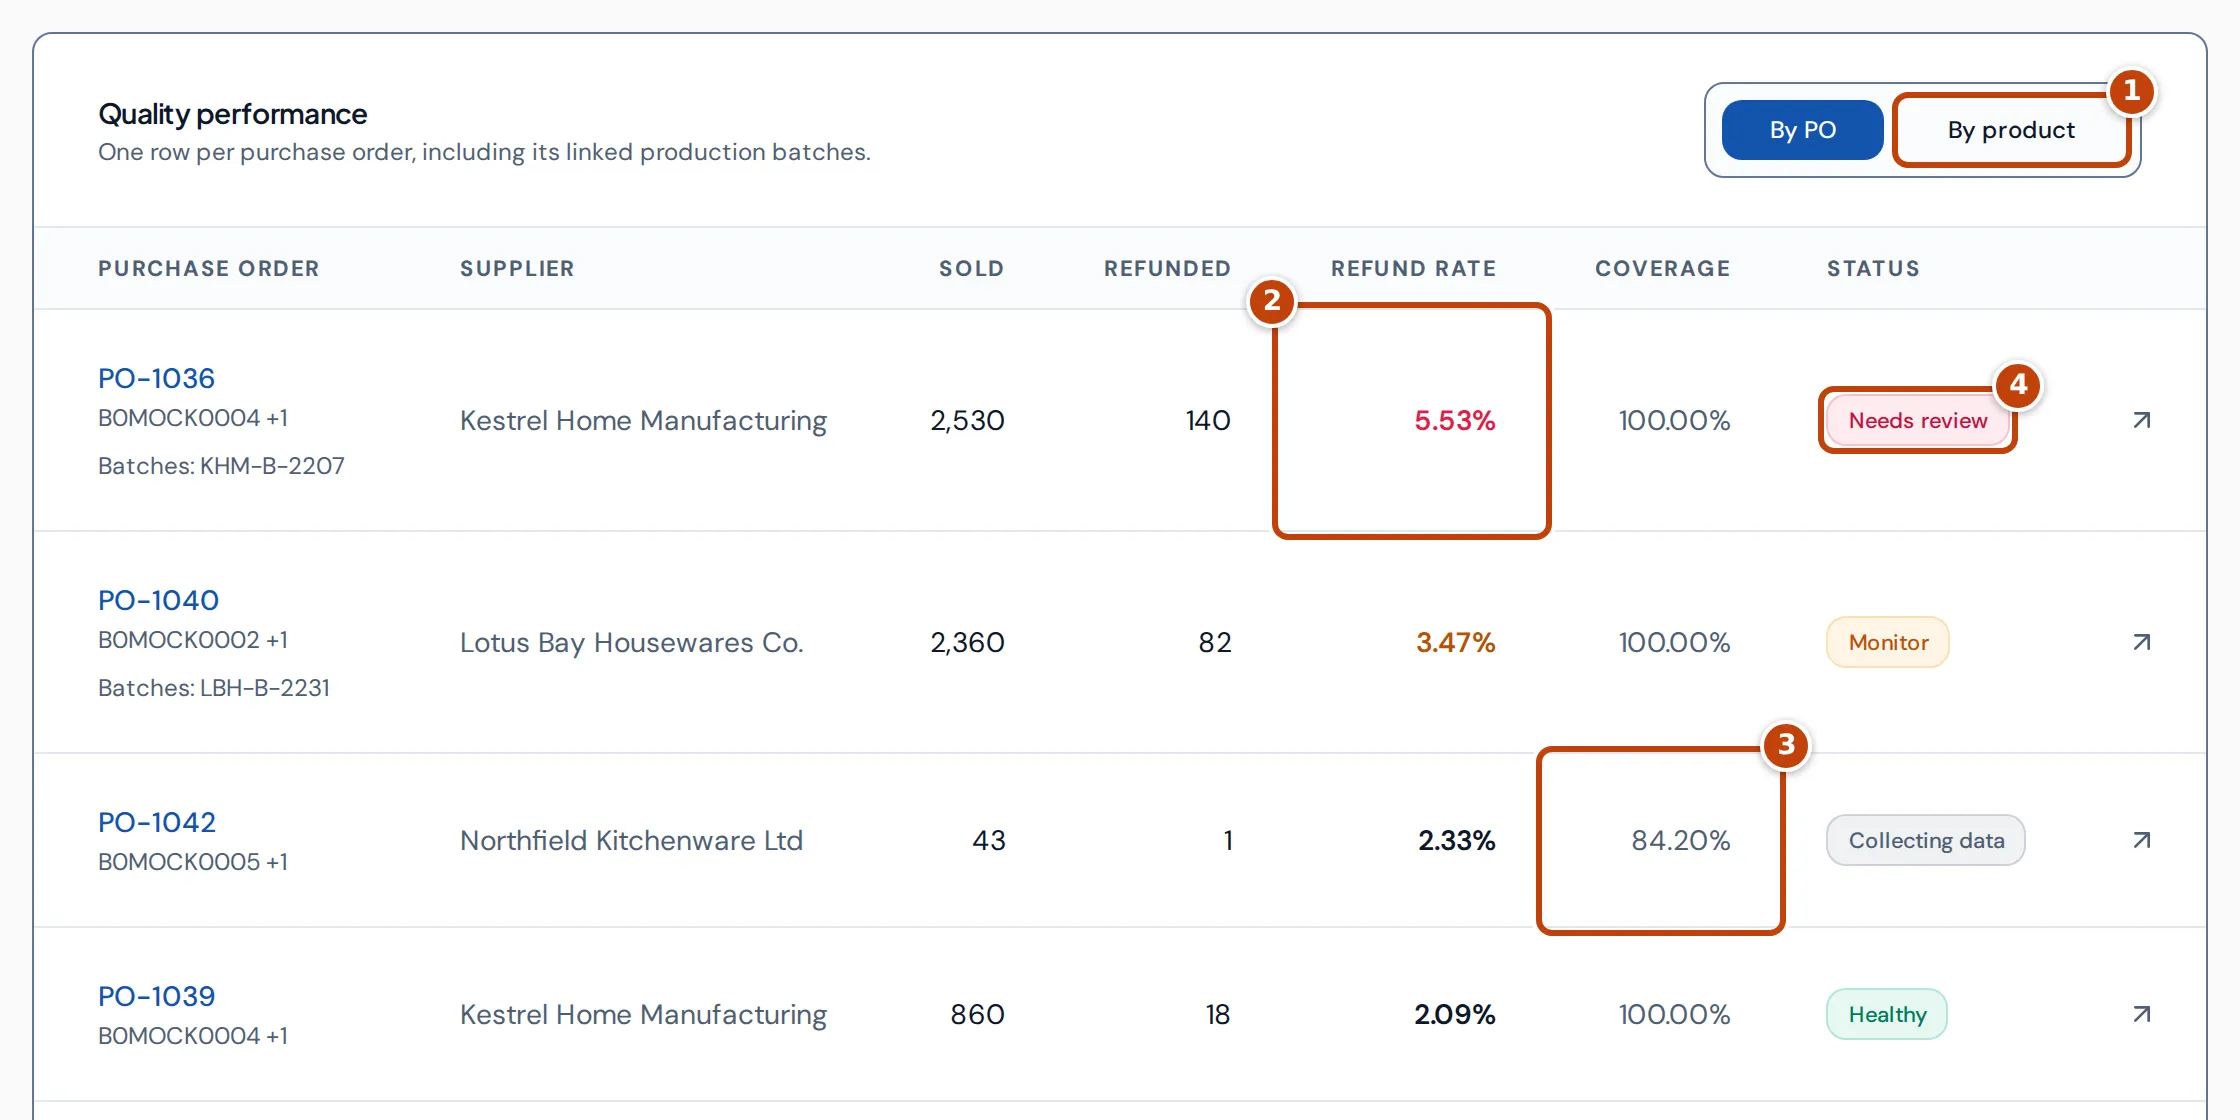
The table has one row per purchase order, including any production batches linked to it. Select marker 1 By product to see one row per product within each purchase order instead. Rows are sorted with the highest refund rate first.
- Purchase order: the PO number with its products, and the production batches it includes. Select the row to open the purchase order. A production batch with no purchase order has its own row, marked Production batch and No linked PO; selecting it opens the Supply pipeline.
- Supplier, Sold and Refunded.
- Refund rate marker 2: amber from 3% and red from 5%.
- Coverage marker 3: how much of the PO’s sold quantity Crateworth could fully cost from stock. A low coverage means some of those sales were only partly traced, so the rate is less certain.
- Status marker 4: see What the statuses mean.
What the statuses mean
Section titled “What the statuses mean”| Status | When |
|---|---|
| Collecting data | Fewer than 50 units sold, or the first sale was less than 30 days ago. There isn’t enough to judge yet. |
| Healthy | Refund rate below 3%. |
| Monitor | Refund rate of 3% or more, but below 5%. |
| Needs review | Refund rate of 5% or more. |
To see only the orders that need attention, choose Needs review or Monitor in the status filter.
Insights
Section titled “Insights”Select Show insights to open the side panel. Crateworth remembers whether it’s open.
- Quality alerts counts production batches by the status rules: Needs review (refund rate at or above 5%), Monitor (at or above 3%) and Low lineage coverage, where less than 90% of the sale quantity is cost-attributed.
- Supplier distribution shows your top suppliers’ refund rates and each one’s share of the sold units Crateworth traced to a supplier.
Why are there no figures, or fewer than expected?
Section titled “Why are there no figures, or fewer than expected?”- The chart says No attributed sales yet: rates appear once received stock from your purchase orders has been sold. Sales are traced from stock received through the Supply pipeline, or posted as historical cost of goods on a purchase order.
- Sold units are lower than your sales: only sales Crateworth can trace to a purchase order are counted. Sales from stock with no purchase order or production batch behind it aren’t included.
- A row says Unassigned supplier: the purchase order or batch has no supplier.
- A recent purchase order shows Collecting data with a high rate: it hasn’t sold 50 units or had 30 days of sales yet.
Related pages
Section titled “Related pages”- Purchase orders
- Suppliers
- Returns for Amazon’s return reasons by product.