
Analytics
Analytics is a workbench of KPIs, charts and tables that you arrange yourself and save as views, such as an overview and a product deep dive. Every widget on a view follows the same period, marketplace and products. To open it, in the sidebar, under Workspace, select Analytics.
What’s on the Analytics page
Section titled “What’s on the Analytics page”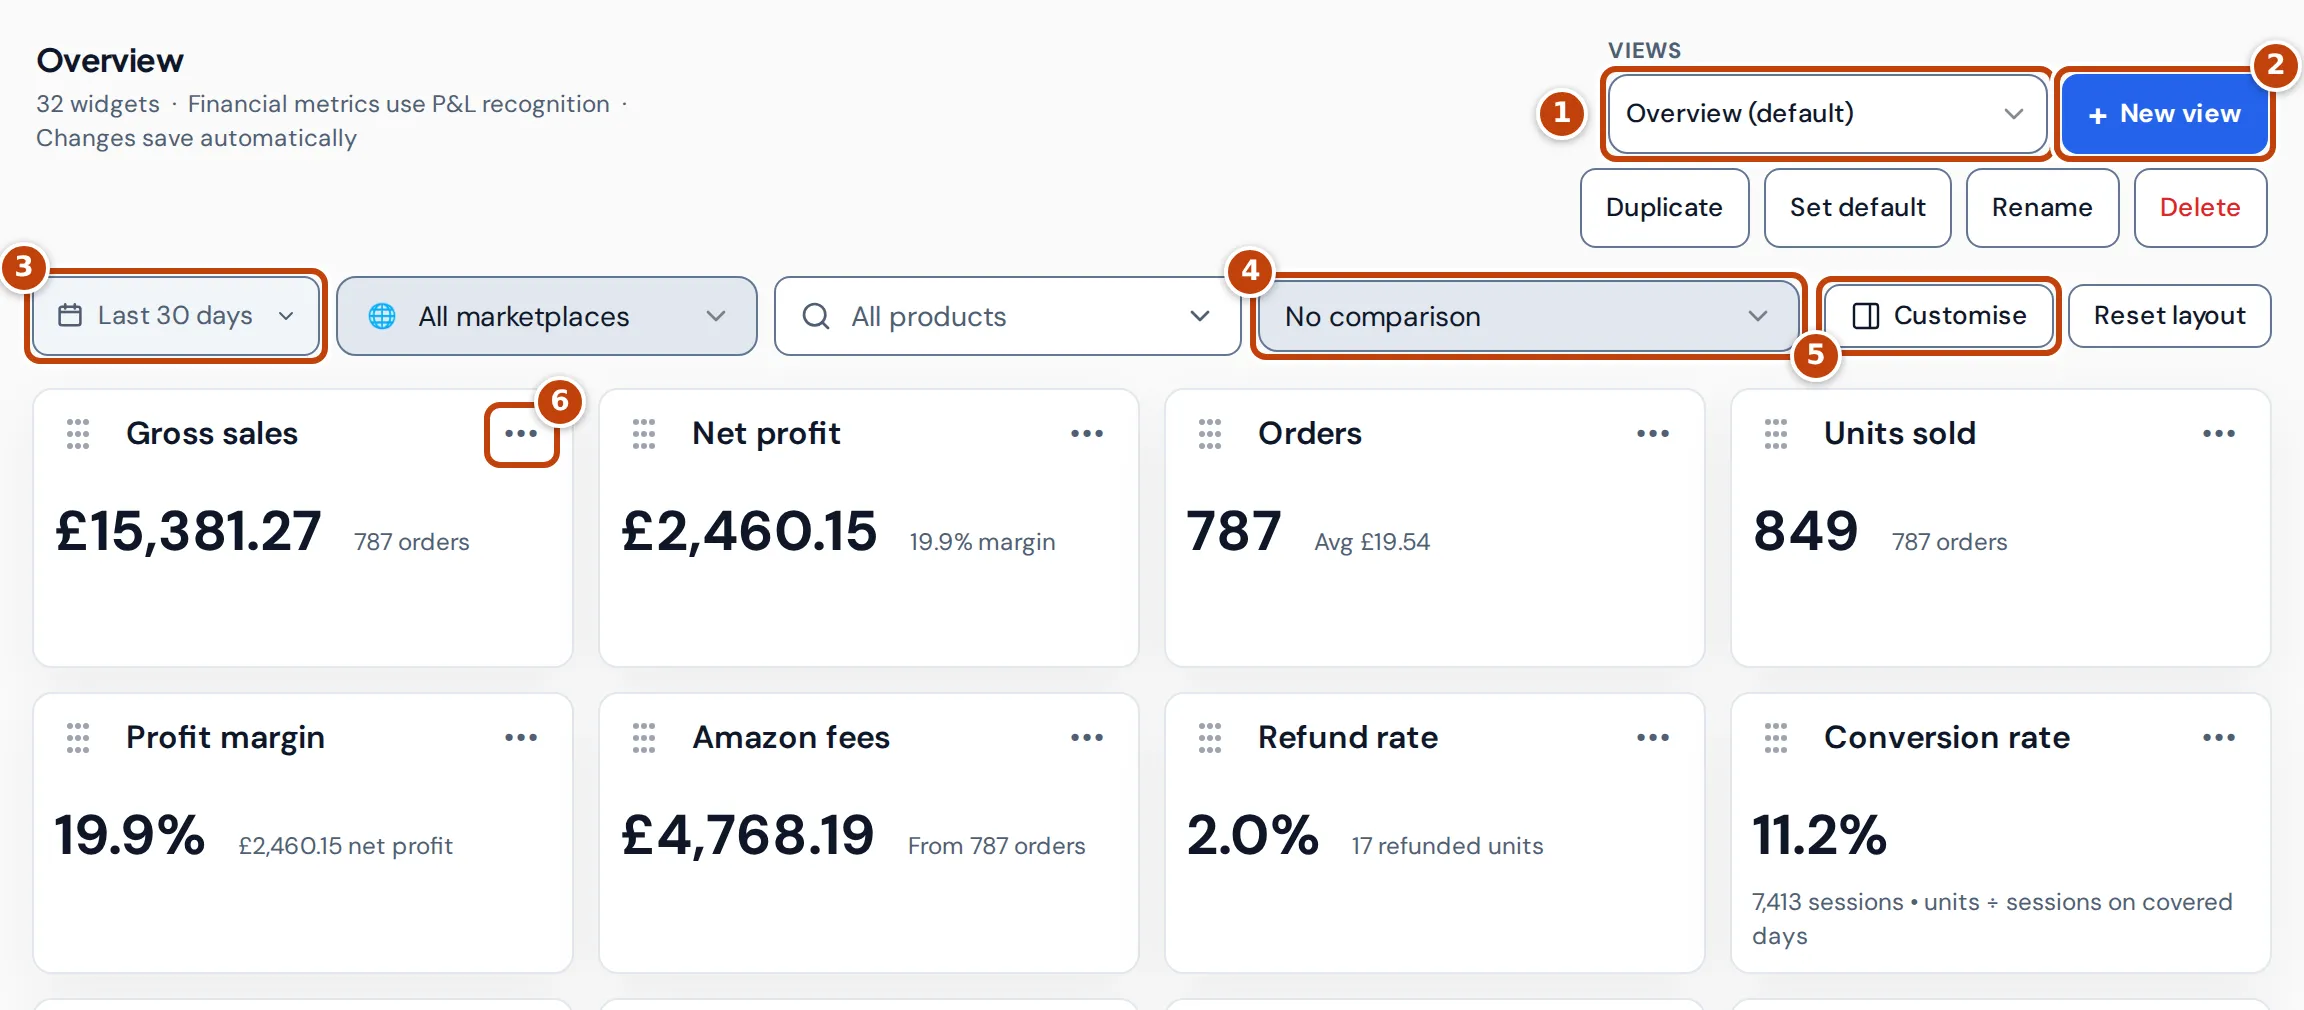
The heading is the name of the view you’re looking at, with its number of widgets. Changes you make to a view save automatically.
- marker 1 Views switches between your saved views. marker 2 New view creates one. Duplicate, Set default, Rename and Delete act on the current view.
- marker 3 The period button chooses the dates: Today, Yesterday, Last 7 days, Last 30 days, Month to date, Last month, This week, Last week or Year to date. Beside it, All marketplaces and All products narrow every widget to a marketplace or to chosen products.
- marker 4 No comparison lets you compare with an earlier period. See Compare with an earlier period.
- marker 5 Customise lists the widgets on the view and opens the widget library. Reset layout puts back the default widgets, order and sizes.
- marker 6 The three-dot button on each widget opens its settings.
Save and switch views
Section titled “Save and switch views”An Analytics view is a saved set of widgets with its own period, marketplace, product and comparison choices. Views belong to the business, so your team members see the same views. When you open Analytics, it shows the view you last used in that browser, or otherwise the default view. The first time you open it, Crateworth creates a view called “Overview” with the standard KPIs and charts.
To create a view:
- On the Analytics page, set up the filters and widgets you want to start from.
- Select New view.
- Enter a View name and select Create view. The new view starts with your current filters and widgets.
To manage the current view, select one of these buttons. Duplicate, Set default and Delete each ask you to confirm first.
- Duplicate makes a copy, named after the original with “(copy)”, and switches to it. The original doesn’t change.
- Set default makes the view the business’s default view, which Analytics opens for anyone who hasn’t used another view in that browser. It’s unavailable on the view that’s already the default.
- Rename changes the name.
- Delete removes the view and its layout permanently. You can’t delete your only view.
Add, configure and arrange widgets
Section titled “Add, configure and arrange widgets”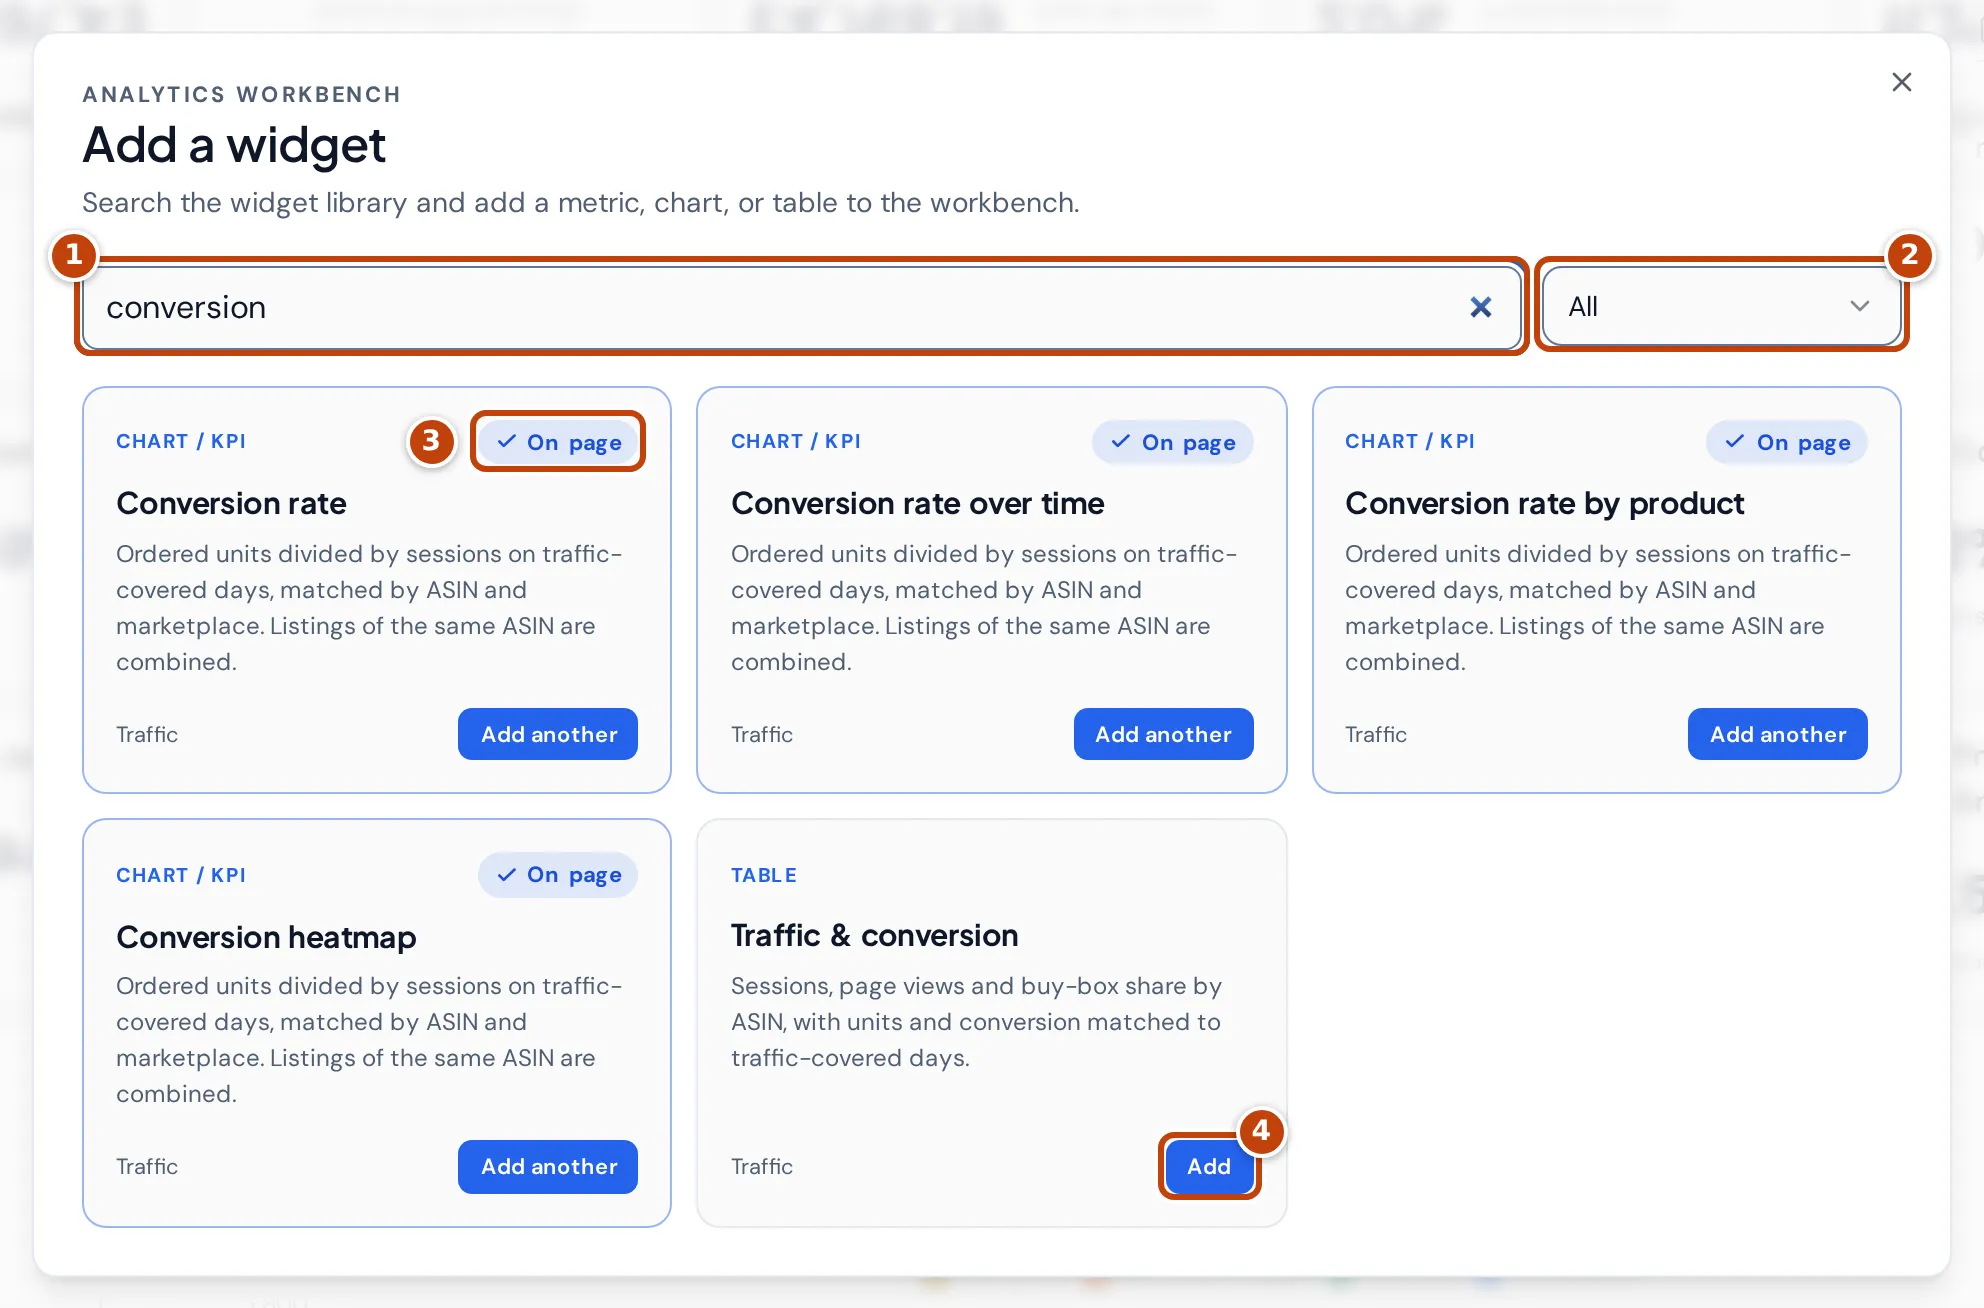
To add a widget:
- On the Analytics page, select Customise.
- Select Add widget. The Add a widget library opens.
- Optional: search marker 1 or choose a category marker 2 (Overview, Profitability, Sales, Traffic, Returns, Inventory or Advertising) to narrow the list.
- Select Add on the widget you want marker 4. The widget is added to the current view.
Each widget is marked as a chart or KPI, or a table. Widgets already on the view show On page marker 3, and their button reads Add another, so you can have the same widget twice, for example with different sizes.
To move a widget, drag it by the dotted handle at its top left. To resize it, drag its left, right or bottom edge.
In the Customise panel, select a widget’s name to jump to it on the page, or use Find a widget to search the view.
Change a widget’s settings
Section titled “Change a widget’s settings”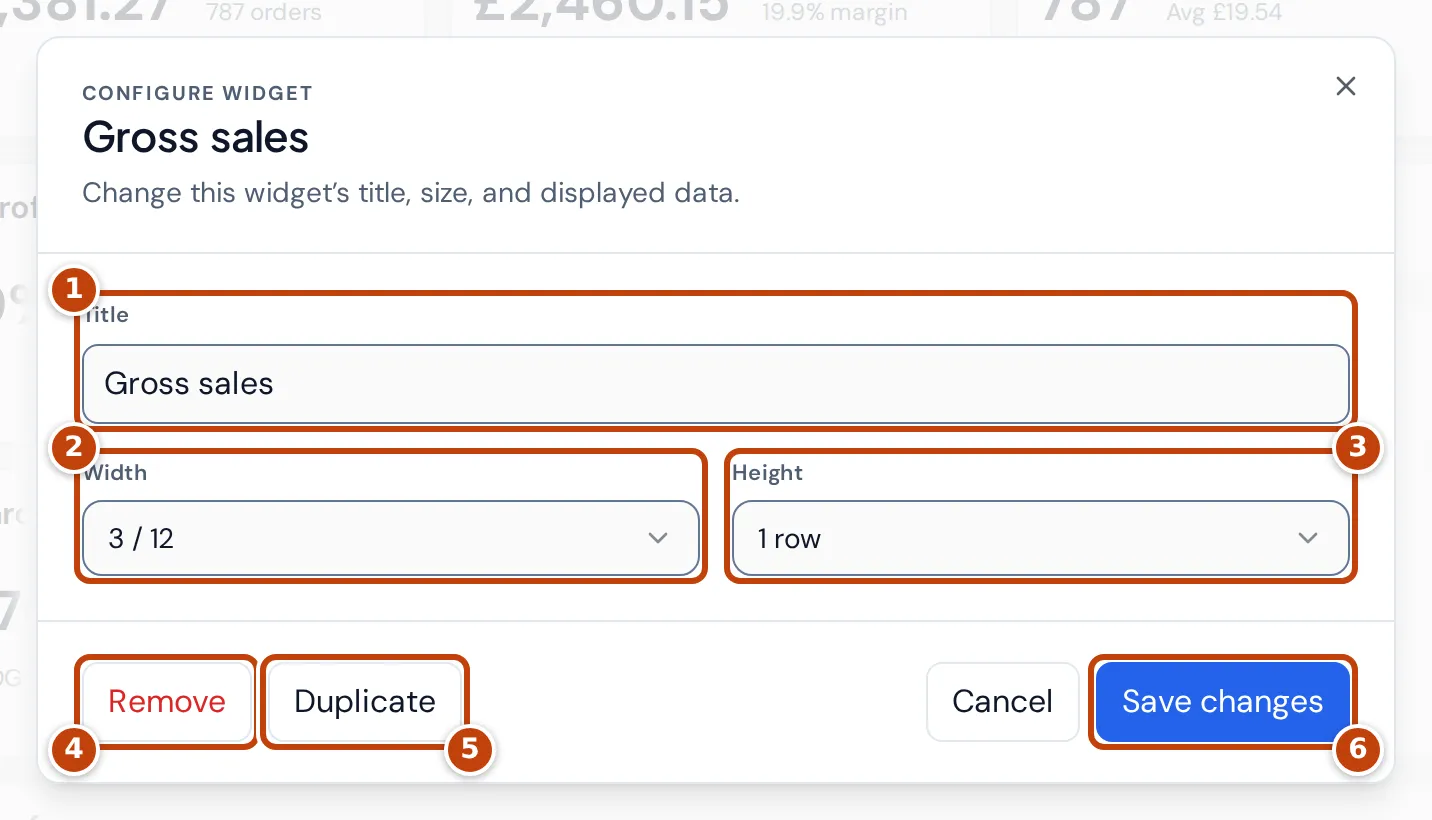
Select the three-dot button on a widget to open its settings:
- marker 1 Title renames the widget on this view.
- marker 2 Width sets how much of the page width it takes, in twelfths.
- marker 3 Height sets how many rows tall it is.
- For tables, Rows, Density and Visible columns (choose at least one) change what the table shows. Product by period has a Metric setting instead of columns.
- marker 4 Remove takes the widget off the view after you confirm. You can add it again from the widget library.
- marker 5 Duplicate adds a copy of the widget.
- marker 6 Save changes applies your settings.
Compare with an earlier period
Section titled “Compare with an earlier period”On the Analytics page, to compare every KPI with an earlier period, open the comparison selector (marker 4 in the screenshot at the top of this page) and choose Previous period, Previous week, Previous month, Same dates last year or Custom comparison period. With Same dates last year, tick Align weekdays (364 days earlier) to compare Mondays with Mondays. For a custom comparison, enter the From and To dates.
Each KPI then shows the change as a percentage, such as “+4.2% vs comparison”. Charts that support it draw the comparison period alongside. To stop comparing, choose No comparison.
What the main Analytics figures mean
Section titled “What the main Analytics figures mean”The Analytics KPI widgets add up the selected period for the selected marketplace and products. Amounts from every marketplace are converted into your reference currency, which you set in Settings.
| Widget | What it is |
|---|---|
| Gross sales | What customers paid for the items, including any VAT in the price, with the number of orders under it. |
| Orders / Units sold | Orders and units in the period. Orders also shows the average order value. |
| Amazon fees | Amazon’s fees on those sales. A fee Amazon hasn’t posted yet uses Amazon’s fee estimate until the actual fee arrives. |
| Cost of goods | The cost of the units sold, from your product costs. |
| Gross profit | Sales after VAT and refunds, less cost of goods. It’s before Amazon fees, advertising and other selling costs. |
| Net profit | Profit after Amazon fees, advertising and your other costs, with the margin under it. |
| Profit margin | Net profit as a percentage of sales after VAT and refunds. |
| Proceeds after Amazon fees | Sales after VAT and refunds, less actual and estimated Amazon fees. |
| Refunds / Refund rate | Refunded units, and refunded units as a percentage of units sold. |
| Conversion rate | Units ordered divided by sessions, on days with traffic data, matched by ASIN and marketplace. Listings of the same ASIN are combined. |
Charts such as Performance, Cost breakdown and Amazon fee mix draw the same figures over time or split by type. The fee mix groups Amazon fees into Referral, FBA, Service, Refund and Other.
Where the Analytics figures come from
Section titled “Where the Analytics figures come from”- Dates: Financial figures follow the P&L: a sale counts when it ships, and a refund on the date Amazon posted it in its finance data. So a period’s totals match the P&L page rather than the Dashboard, which counts orders on the day they were placed. See Profit and loss.
- Sales, orders and fees come from your Amazon orders and Amazon’s finance data. Cost of goods comes from your product costs and purchase orders.
- Sessions and conversion come from Amazon’s sales and traffic data, by ASIN and day. Days without traffic data are left out of the conversion rate.
Why an Analytics widget is blank, “Unavailable” or marked
Section titled “Why an Analytics widget is blank, “Unavailable” or marked”- Unavailable on a KPI, or a message with Retry on a chart, means that widget’s data couldn’t be loaded. Select Retry. Source issue next to a widget’s title means the same.
- — for Profit margin or Conversion rate means there’s nothing to divide by, such as no sales after VAT and refunds, or no traffic data for the period.
- Cost breakdown unavailable means a cost in the period isn’t known yet, so the chart can’t add up to net profit. When it can, it says which, such as “Cost of goods not yet known for 22 items sold”. Cost of goods for an item sold is known once Amazon confirms its shipped quantity and the product has a cost.
- Not product scoped appears when you’ve chosen products and a widget can’t be filtered by product, such as Payouts, which is settlement-level. It still shows the whole business.
- “Updating” after the subtitle means Crateworth is refreshing the P&L figures. The page shows the last complete figures, with the time they’re from, until it finishes.
If someone else sees different Analytics widgets
Section titled “If someone else sees different Analytics widgets”On Analytics, team members whose access hides profit don’t see widgets built on profit, costs, fees or margin, and can’t add them from the library. The widgets stay saved in the view for everyone else.
Demo mode, in the account menu, hides product names, ASINs, SKUs and images so you can share your screen.
Related pages
Section titled “Related pages”- Dashboard for today and recent periods side by side.
- Trends for one figure by product across many periods.
- Why figures differ from Seller Central