
Operations
The Operations page gives you an operational view of the business on one screen: the stock you can sell and the stock on its way, pending Amazon payouts and supplier payments, the actions that need you, and how fresh each source of data is. It complements the Dashboard, which covers sales and profit. To open it, in the sidebar, under Workspace, select Operations.
What’s on the Operations page
Section titled “What’s on the Operations page”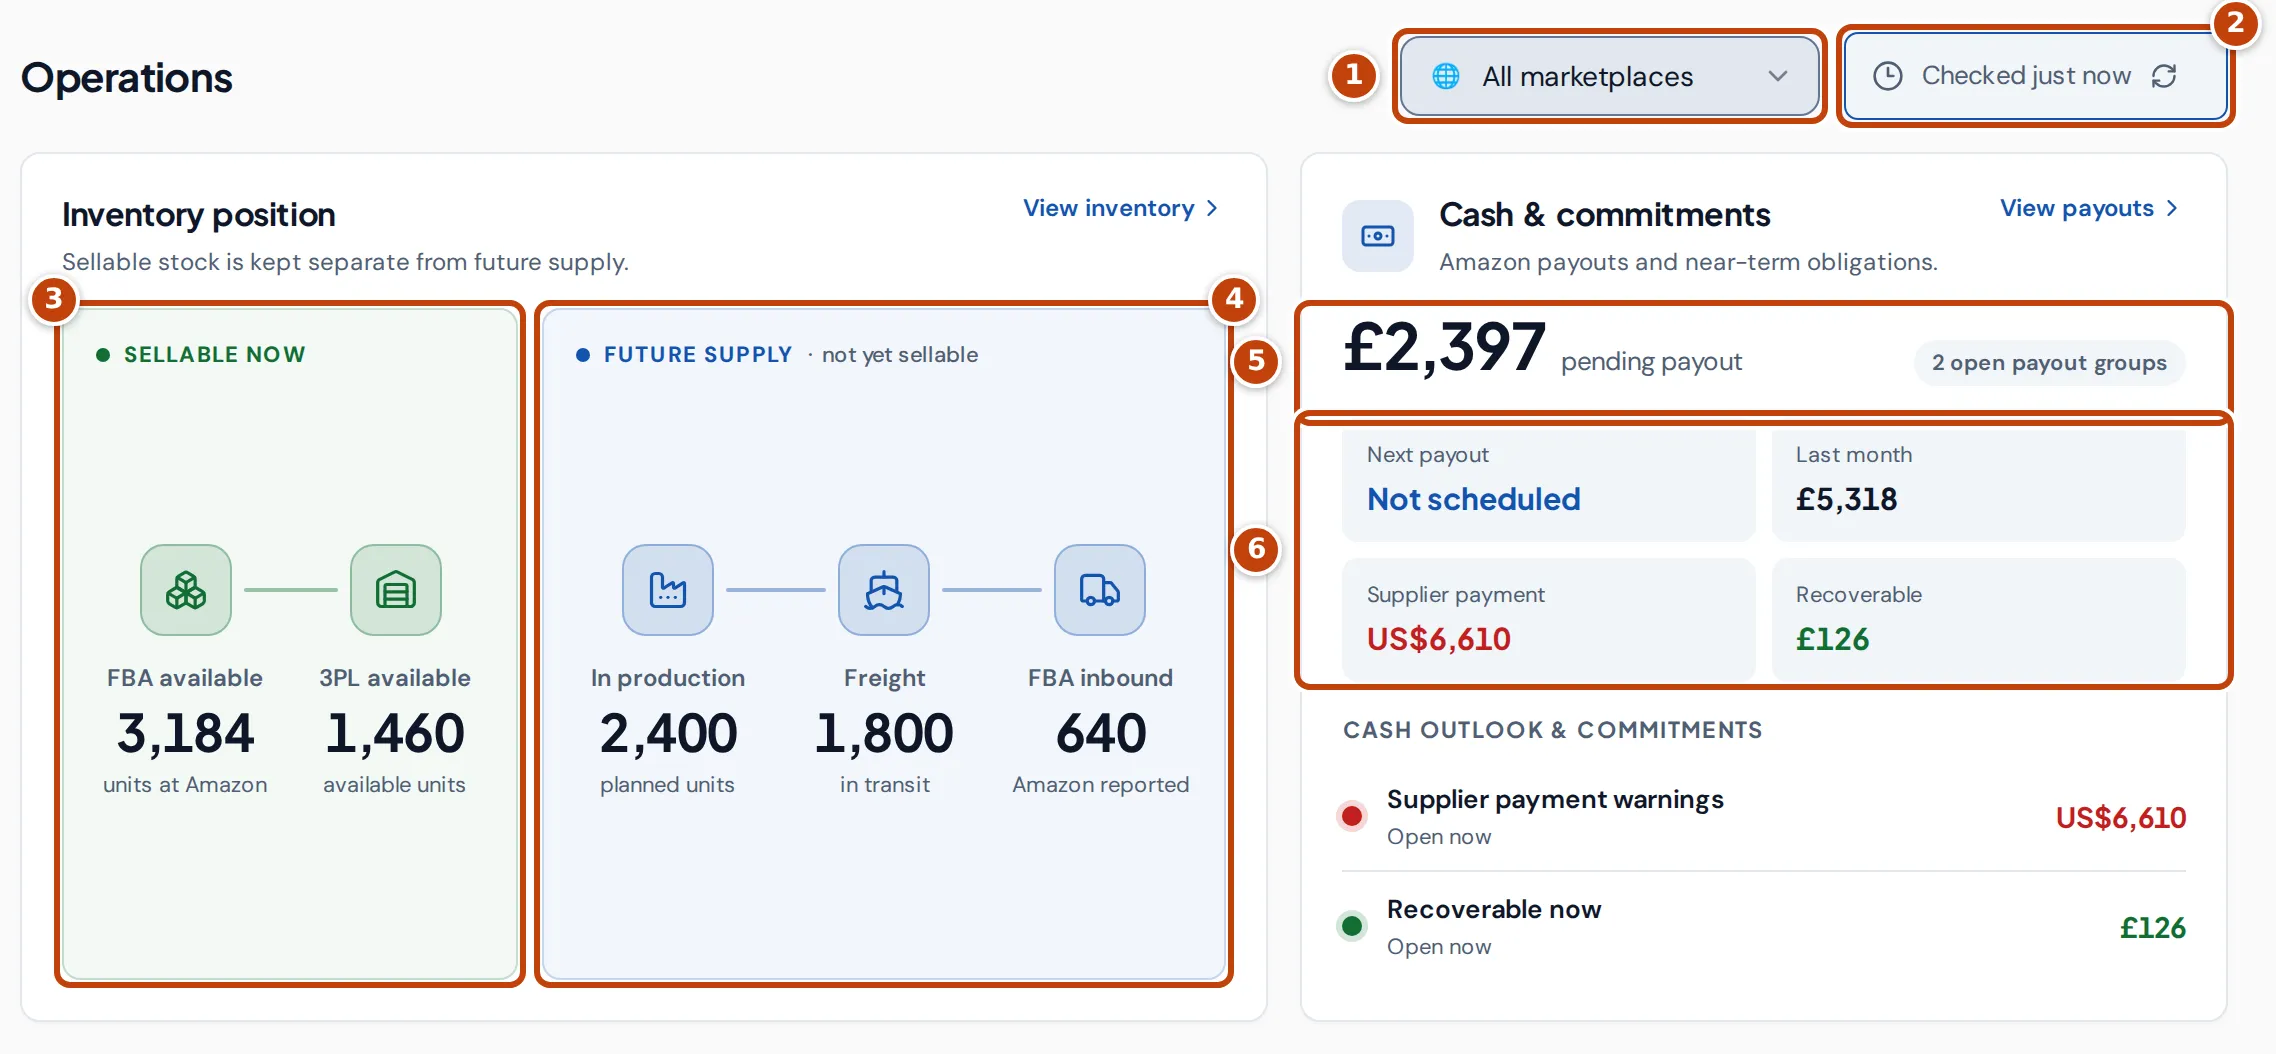
Along the top:
- marker 1 All marketplaces limits the page to one marketplace. It starts at all marketplaces on every visit.
- marker 2 The Checked button shows when the page last fetched its data, such as “Just now” or “5m ago”. Select it to fetch everything again. It’s not the age of Amazon’s data: Data freshness at the bottom of the page shows that.
Below, from top to bottom: Inventory position and Cash & commitments; Priority actions with the FBA inbound, Inventory health and Listings cards; the Logistics map; and Data freshness.
Each card loads on its own, so one source that fails to load doesn’t blank the others. If every source fails, the page shows Operational data could not be loaded. with a Retry button.
Inventory position
Section titled “Inventory position”The Inventory position card keeps stock you can sell now apart from stock that isn’t sellable yet. Select a figure to open the page behind it.
marker 3 Sellable now:
- FBA available: units at Amazon that are available to sell, from Amazon’s latest inventory data. With all marketplaces selected, stock in a pool that Amazon shares between marketplaces (such as Europe) counts once. It shows — when there’s no Amazon stock data yet or Amazon’s figures can’t be tied to one stock pool.
- 3PL available: available units in the third-party warehouses you’ve set up in Crateworth, across all marketplaces whatever you select at the top of the page. Under the figure, setup required means you haven’t added a 3PL warehouse yet.
marker 4 Future supply (not yet sellable):
- In production: units still to come from your suppliers’ production batches that are in production or partly shipped, after any cancelled or already shipped units. Draft batches aren’t counted.
- Freight: units on shipments in your supply pipeline that are in transit or delayed and not yet linked to an Amazon inbound shipment. When some are delayed, the line under the figure says how many.
- FBA inbound: the inbound quantity Amazon reports in its inventory data.
Cash & commitments
Section titled “Cash & commitments”The Cash & commitments card shows Amazon money owed to you and payments you owe. Amounts are in your reference currency (set in Settings), rounded to whole units.
- marker 5 The large figure is the pending payout: the total of Amazon settlements that are still open, with the number of open payout groups beside it.
- marker 6 Four smaller figures:
- Next payout: the earliest upcoming transfer date Amazon has given for an open settlement, or Not scheduled when there isn’t one.
- Last month: what Amazon successfully transferred for settlements that closed with a transfer date in the previous calendar month.
- Supplier payment: what you still owe on purchase orders whose payment terms require payment before the goods ship, for orders whose production batch isn’t closed or cancelled. It’s the order’s total cost less the bank payments you’ve matched to it as supplier payments, in the order’s own currency, and shows in red when something is owed. If those orders use more than one currency, it shows the number of warnings instead of an amount.
- Recoverable: the estimated value, less anything already reimbursed, of open Amazon Money Back claims that are ready to file or already filed. See Amazon Money Back.
Under Cash outlook & commitments, up to three rows list the next payout date, supplier payment warnings and the amount recoverable now (only when there is one). View payouts opens the Payouts page.
Priority actions
Section titled “Priority actions”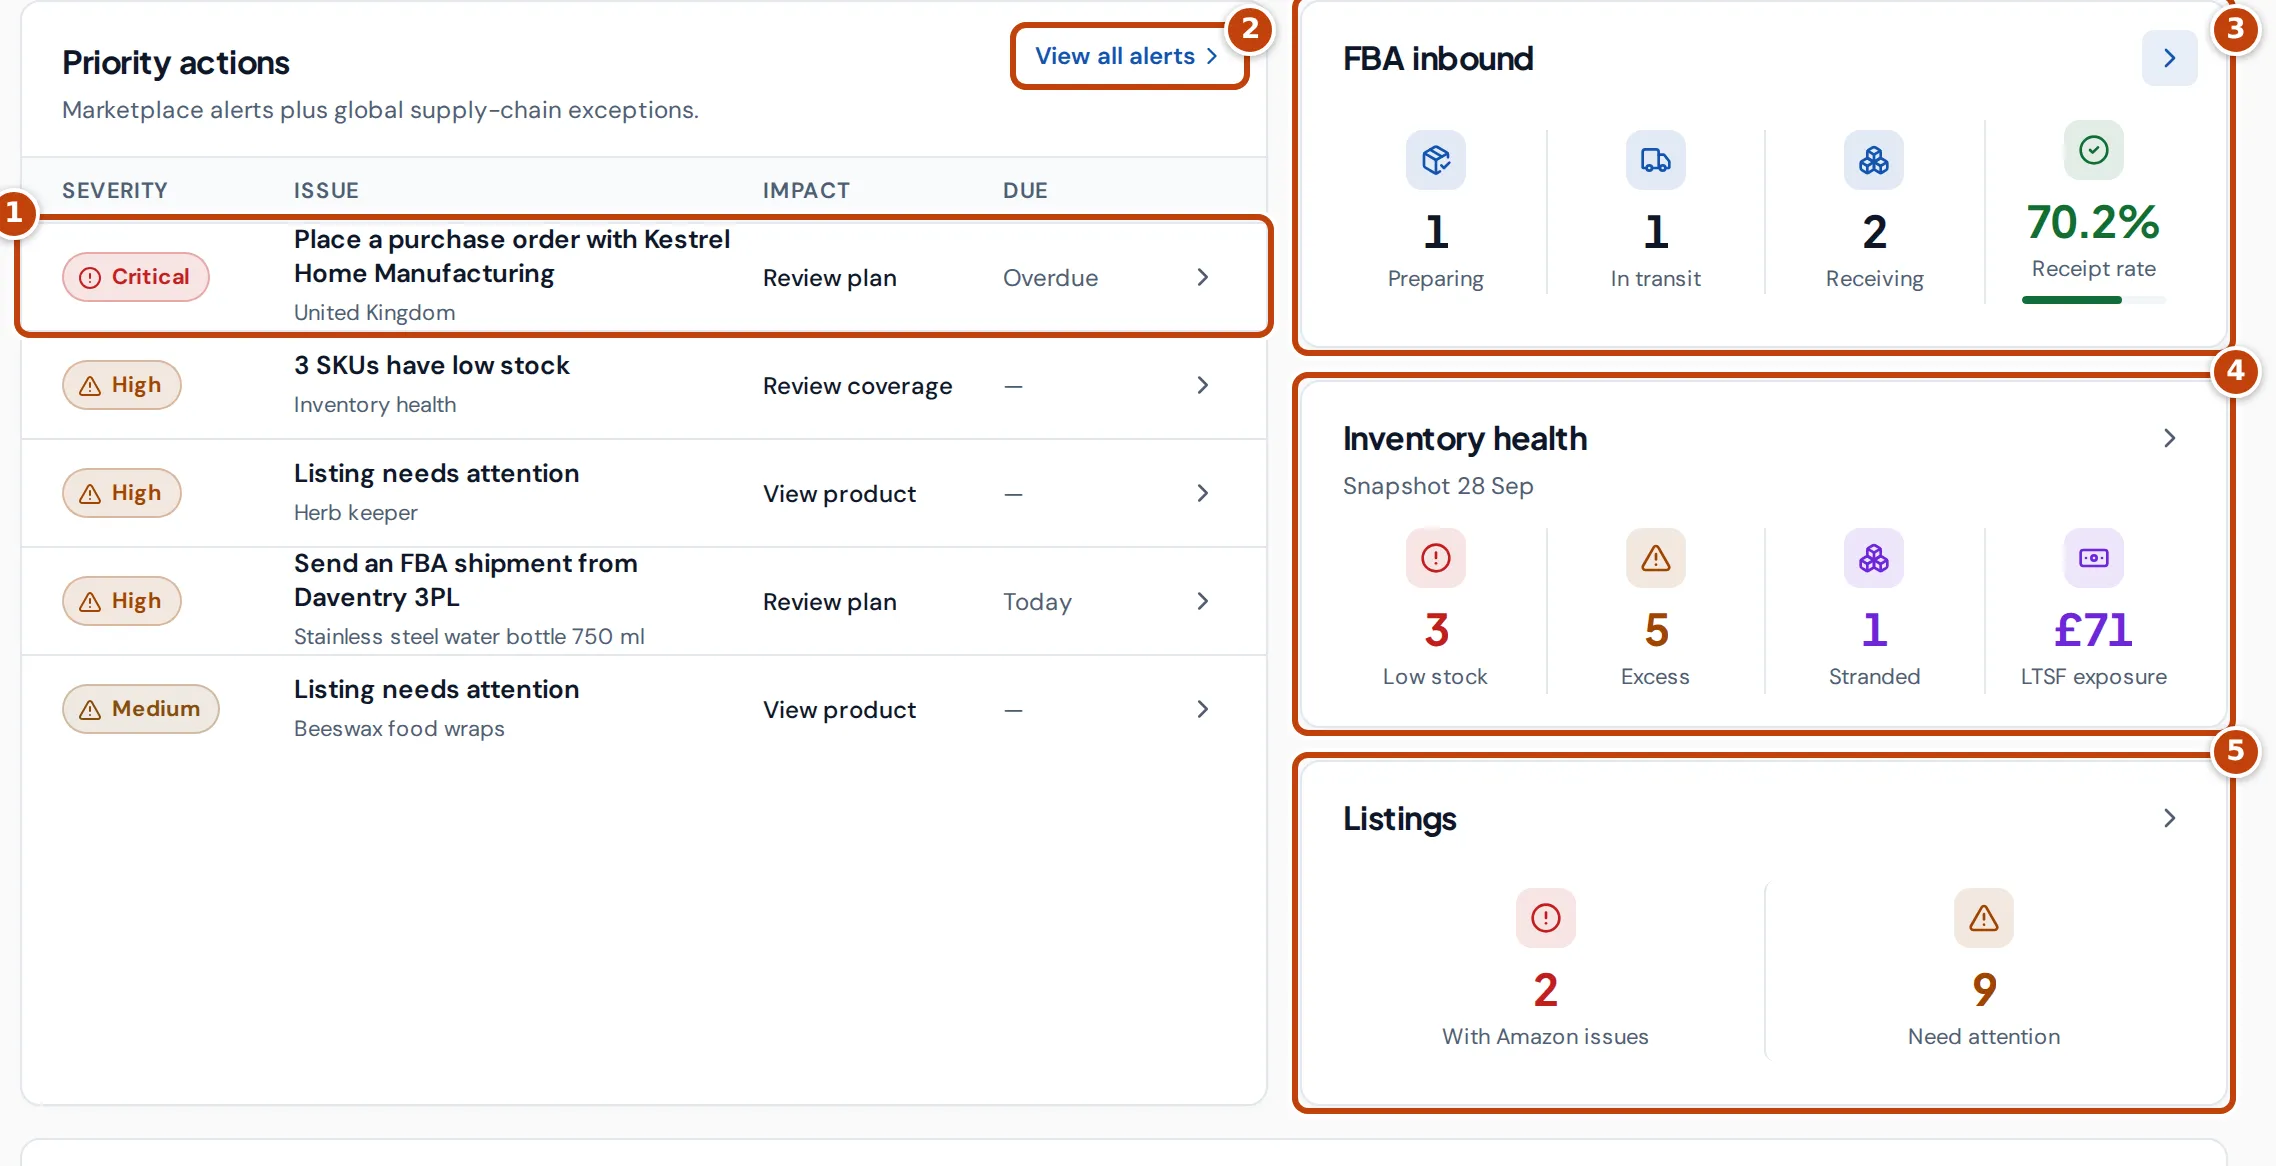
The Priority actions table on the Operations page shows the five most urgent things that need you marker 1. Rows are sorted by severity (Critical, High, Medium, Low, Info, the same priorities as on the Alerts page), then oldest first. Select a row to go where you can deal with it, or select View all alerts marker 2 for the full list on the Alerts page.
Due shows a date only when the source has one: the date a restock alert’s task should start by, or the due date on a supply-chain exception (Overdue, Today, Tomorrow or the date). Other rows show —, because they say what’s wrong rather than when it must be done by.
The rows come from:
- Your open alerts, such as a reorder that’s due. Snoozed alerts are left out. See Alerts.
- Supply-chain exceptions on your shipments and production batches, such as a shipment that is late, has no ETA, has stale tracking, has a receiving discrepancy, has no receiving destination or isn’t linked to an Amazon inbound shipment, or production that is overdue or has no completion date. These cover all marketplaces whatever you select at the top of the page.
- Summaries of other cards: SKUs with low stock in Inventory health, units delayed in transit, FBA inbound data that needs attention, and listings with Amazon issues.
When nothing needs you, the table shows No priority actions.
FBA inbound, Inventory health and Listings
Section titled “FBA inbound, Inventory health and Listings”On the Operations page, three smaller cards sit beside Priority actions. Select the arrow on a card to open its page.
marker 3 FBA inbound counts your Amazon inbound shipments by stage: Preparing, In transit and Receiving. Receipt rate is the units Amazon has received as a percentage of the units expected, across all your inbound shipments, including closed and cancelled ones. Sync needs attention appears when Crateworth couldn’t refresh inbound shipments from Amazon recently. See FBA inbound.
marker 4 Inventory health shows figures from Amazon’s latest inventory planning report, dated under the card’s title, and from Amazon’s latest inventory data:
- Low stock and Excess: SKUs that Amazon’s planning report rates as low on stock or in excess, counted once per marketplace.
- Stranded: products with stranded units in Amazon’s latest inventory data.
- LTSF exposure: Amazon’s estimate of the next long-term storage fee, from the planning report, in your reference currency.
See Inventory health.
marker 5 Listings shows how many listings Amazon reports issues for (With Amazon issues) and how many Need attention: those with Amazon issues, incomplete content (a missing title or description, fewer than five bullet points, no search terms or fewer than seven images), or an Amazon-created listing that has stock but can’t be bought. Select a figure to open the Listings page with that filter. See Listings.
Logistics map
Section titled “Logistics map”
The Logistics map on the Operations page shows goods on the way to stock: production at your suppliers, freight shipments, and Amazon inbound shipments on their way to Amazon. A list beside the map shows each item on the map with its reference, route, expected date (or Delayed) and quantity.
- marker 1 In production, Freight and 3PL to Amazon show or hide each kind of item. Each shows how many there are. 3PL to Amazon covers Amazon inbound shipments that are ready to ship, on their way or being received, and were updated in the last 180 days. Shipments already shown as Freight aren’t repeated.
- marker 2 Fit all zooms the map to show everything.
- marker 3 Open in supply pipeline opens the same map on the supply pipeline page.
Select an item on the map or in the list to see its supplier, route, quantity, timing and carrier, with a link to its purchase order, shipment or FBA inbound shipment. Select a port or warehouse on the map to list only the items there. A solid line is a sea route from container tracking, a dashed line is the usual lane or an estimate, and an arrow is the ship’s reported or estimated position and heading. Items without a location on record are listed, by reference and route only, under “not on the map”. Add an origin port, warehouse or destination to place them.
Data freshness
Section titled “Data freshness”
Data freshness, at the bottom of the Operations page, shows how up to date each source is marker 1:
- Inventory: the date of Amazon’s latest inventory planning report.
- Payouts: when Crateworth last saw your Amazon settlements.
- Supply: when your production batches were last updated.
- FBA inbound: when inbound shipments were last refreshed from Amazon.
- 3PL: when 3PL stock was last updated.
A green dot means the source is up to date. An amber dot with Out of date beside it means Crateworth has nothing newer than expected from Amazon:
- Inventory is out of date when Amazon’s latest planning report is older than yesterday’s. Amazon publishes it once a day, so a report dated yesterday is current.
- FBA inbound is out of date when Amazon’s inbound shipments for one of your marketplaces haven’t been refreshed for more than 90 minutes. They’re normally refreshed every hour.
Payouts, Supply and 3PL show when those records last changed, which can be a while ago without anything being wrong, so their age doesn’t turn them amber.
An amber dot with Needs attention, or Incomplete in place of the age, means the source is only partly available, for example there’s no planning report yet, an exchange rate is missing, the inbound sync from Amazon has a problem or no 3PL warehouse is set up. Red, with Unavailable, means the source couldn’t load, and grey means it’s loading. Hover over an amber or red item to see what’s wrong.
Why an Operations figure is blank or “Unavailable”
Section titled “Why an Operations figure is blank or “Unavailable””- — on the Operations page means that source couldn’t be loaded or has no value, such as FBA available when Amazon’s stock can’t be tied to one pool.
- Unavailable on an amount means the source couldn’t be loaded, a currency conversion rate is missing, or your access doesn’t include profit figures. Team members without profit access see Unavailable for the pending payout, Last month, Recoverable and LTSF exposure.
The Operations page needs access to Sales & analytics. Team members who can’t see inventory don’t see the Logistics map, and most stock figures show — for them. Those who can’t see listings don’t see the Listings card.
Related pages
Section titled “Related pages”- Dashboard for sales and profit by period.
- Supply pipeline for production and freight.
- Payouts for Amazon settlements.